Selecting data
In addition to the online visualization, the Dewesoft Analyse mode offers several functions to have a more detailed look on the recorded data:
We have options to narrow range/area of displayed data and select only a desirable part -> zoomed data * Measurement cursor * Lock Measurement cursors * Zoom-in with Cursors * Zoom-in with Plus/minus button or manually adjusting time axis * Box zoom
Measurement cursor
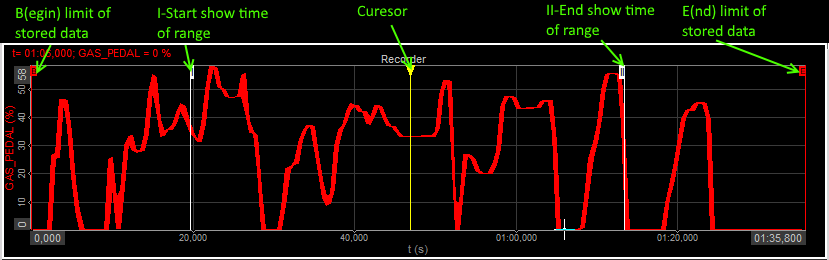
The recorder and vertical recorder offer two measurement cursors for the active graph on top labeled with ” I ” for Start show time and ” II ” for End show time. You can drag these cursors to select a certain region in two ways:
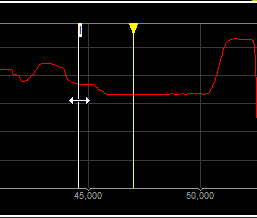
- move mouse cursor to the first position of interest; click (measurement cursor ” I ” appear on this position) and hold left mouse button and move (on mouse cursor appear measurement cursor ” II ” and move whit him) to the second position of interest
- drag the first cursor ” I ” from leftmost side of the graph to the position of interest and the second cursor ” II ” from the rightmost side of the graph (when mouse point on vertical line of measurement cursor mouse cursor change to two-sided arrow which indicate feasibility to move measurement cursor)
It’s no matter in which recorder you use the cursor; it will automatically move in all displayed recorders and vertical recorders simultaneously.
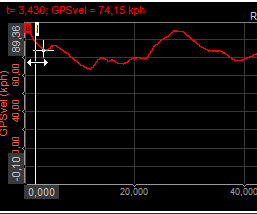
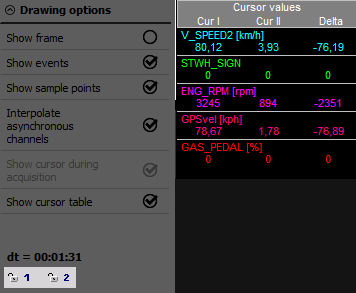
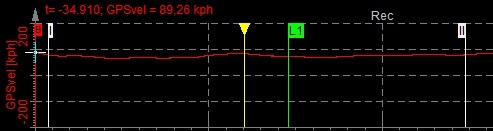
On the left part of the display, the readout values of the currently selected graph at cursor position will be displayed. To show values from another graph, simply click on it and the values will change. As there is only one-time base available, the cursor position is the same for all displayed graphs:
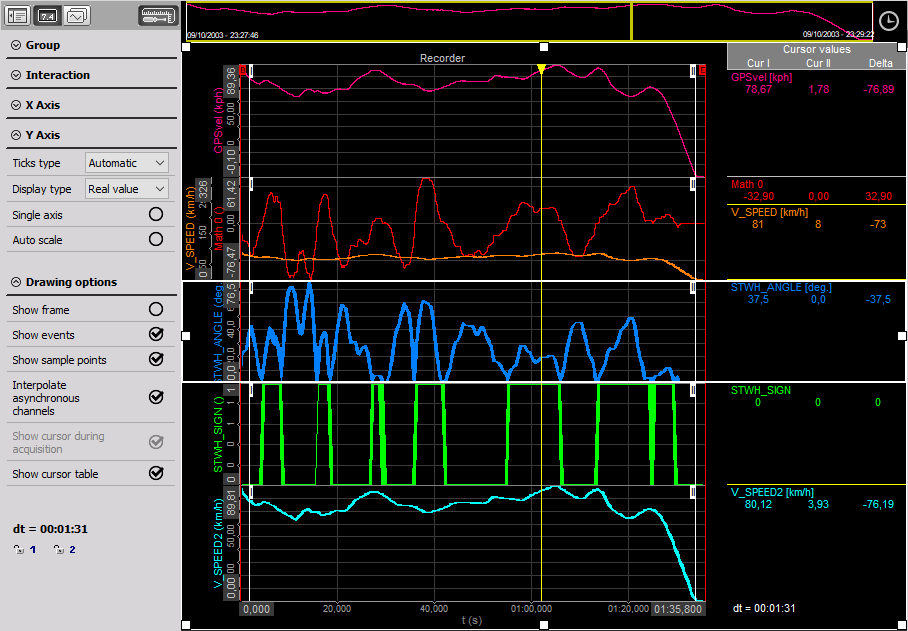
As we can see above, in Analyse mode on left part of screen below recorder settings (same also by vertical recorder) appear new section to display readout values of signals and time at cursor position - Time and values cursor with icon to lock cursor (see also Lock Cursor 1 to selected position).
Lock Cursor 1 to selected position
We can position the measurement cursors anywhere within the acquired signal. But what to do if you have to measure a precise value over a long time? The resolution may not be enough to set the measurement cursors at the exact positions.
The solution is quite simple: Zoom into your signal at the point where you want to place the first cursor and position cursor 1 there. Now press the
![]()
icon to fix cursor 1 (” I “) to its current position. Lock cursor icon change to
![]()
and the cursor will now change to green color and the number at its top changes to locked.

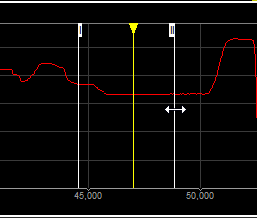
Now you can zoom out and in again to the desired second position. During that you will see a new cursor 1, but this one is only used for zoom issues - not for measurement. The ‘original’ cursor 1 is still locked at its position. Use cursor 1 and 2 as described before to define the second area of interest. Now move the cursor 2 to the point of interest and you can readout the desired value from the Time and cursor values readout section.
To unlock cursor 1 position simply press
![]()
icon again - the cursor
disappears and cursor 1 is again available for new locks. We can also lock cursor 2.
Zoom-in with Cursors
After loading the data, you will always see the signal over the complete storage time. But you can also see details - zoom into the area with:
Just use both measurement cursors as described above to select an area of interest (see also -> Displaying data).
Move the mouse between these two measurement cursors - it will change the appearance immediately to zoom icon. Then simply do a left mouse click to zoom into the selected area. We can do this several times to come to the region of interest. We can also drag the x scale left and right to position the data exactly. To undo the zoom just use the right mouse button and you will zoom out step by step to the full scale.
Zoom-in with Plus/minus button or adjusting the time-axis manually
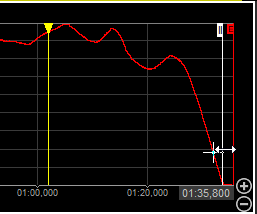
The other way is to zoom into the area with the plus and minus buttons that apear on the bottom right corner of the recorder.
To undo the zoom use the Minus button and you will zoom out step by step.
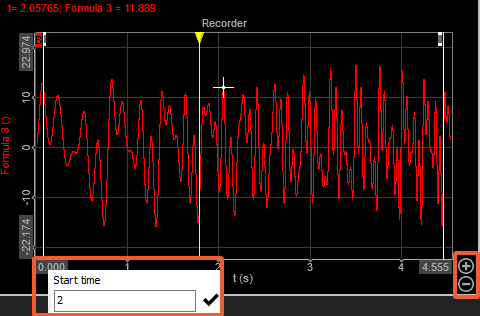
Additionally you can adjust the start and stop time - simply click on the start time or end time and enter the values inside.
If the X-axis is set as Relative time display you can enter the value in the following way (example is for 100seconds): - in seconds [100] - in minuts and seconds [1:40]
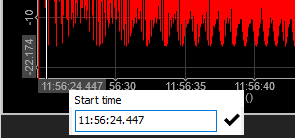
If the X-axis is set to Absolute time display, you need to stick to the form provided.
NOTE: As there is only one time base available all graph are zoomed in (or out) together, independent which button is selected.
You can do that action several times to zoom into the selected area step by step (in each step it is decreased by the range of about 1/25 of the prior range) and is meaningless in what place is the cursor.
By first zoom out, graph returns to previous zoom (range) and after that, step by step. If we use before multiple zoom (with + button or measurement cursor), in the first step displayed range returns to about 3/4 of its whole range and after that step by step.
After zoom into the selected area, you will see now more details.
The signal overview bar at the top of the recorder display shows always the current position within the signal. You can also click on the marked area and move the marker - this will also move the displayed signal.
You can do that action several times to see the information of real interest.
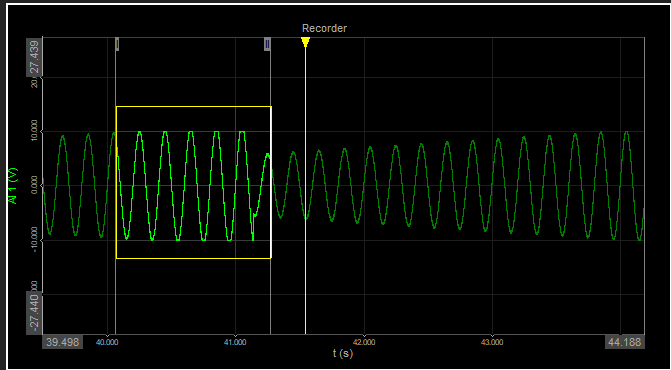
Zoom-in X and Y axis at once
With the BOX-zoom option you can also zoom into the x-axis and y-axis at the same time. You need to position your mouse on the recorder, press SHIFT button and click the left-button on the mouse. With everything pressed you can slide on the recorder to select your area you want to zoom in. A yellow box will give you the indication of the selected area.