Modal Analysis
Modal analysis is used to estimate modal models of structures. From modal models the vibration characteristics (natural frequencies, damping ratios and mode shapes) can be obtained of mechanical structures or component, showing the movement of different parts of the structure under dynamic loading conditions.
Modal analysis plugin is available only in Analyze mode.
Modal test is used for measuring excitation and response channels from which FRF results are calculated. Modal analysis is using the FRF results from Modal test to estimate modal models of simple and complex structures. For more information about Modal test take a look at the Modal test manual.
Input Channels
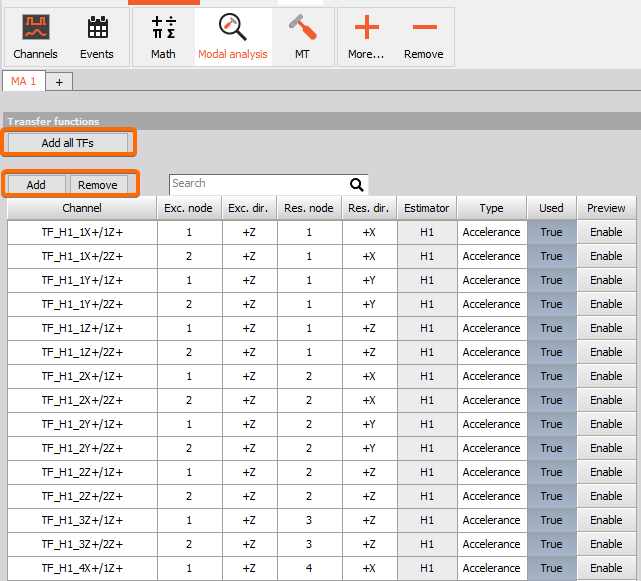
The input into modal analysis module are transfer functions calculated in modal test module
The transfer function can be added with an option Add all TFs. Transfer functions can be separatelly added or removed with Add or Remove button.
When TFs are added, we can see the channel name, excitation node and direction, response node and direction and type of the signal.
NOTE: If you have to add FRFs also coming from other datafiles then this procedure is described under the section Merging mulitple datafiles.
Transfer Function Preview
To see the preview of selected TF enable the Preview option and go to Transfer function preview tab.
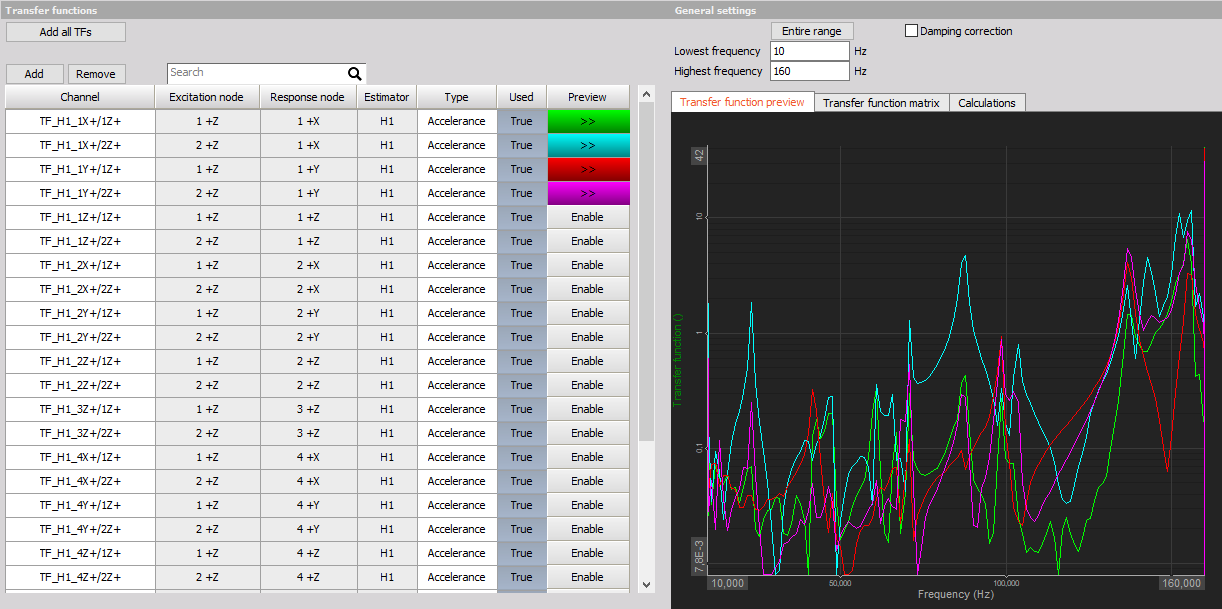
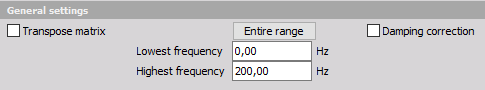
General Settings
Transpose matrix option enables the user to transpone mode shapes matrix. Original matrix show responses is rows and shapes in columns. With transpose option, the modes are displays in columns and responses in rows.
Freqency range selection offers the user to make a modal analysis only in the selected frequency range.
Damping correction should be enabled if a exponential window was used to acquire the data.
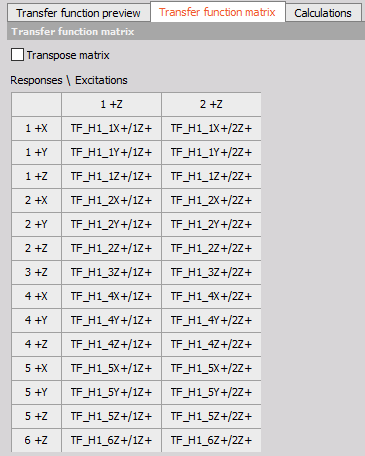
Transfer Function Matrix
The transfer function matrix gives an overview of the set of functions that is set to be Used for modal parameter identification.
The Transpose matrix checkbox should be checked if the response channels are used as reference.
Calculations
Max order - increasing the order of the estimation will also increase the number of estimated poles. When the estimated poles begin to only change a little between individual neighbor orders, then the poles are said to be stable.
Frequency tolerance - defines the limit for how much neighboring poles must deviate in frequency to be Frequency stable poles.
Damping tolerance - defines the limit for how much neighboring poles must deviate in damping to be stable poles with respect to damping.
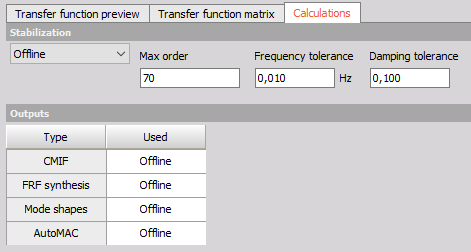
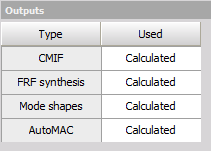
Output Channels
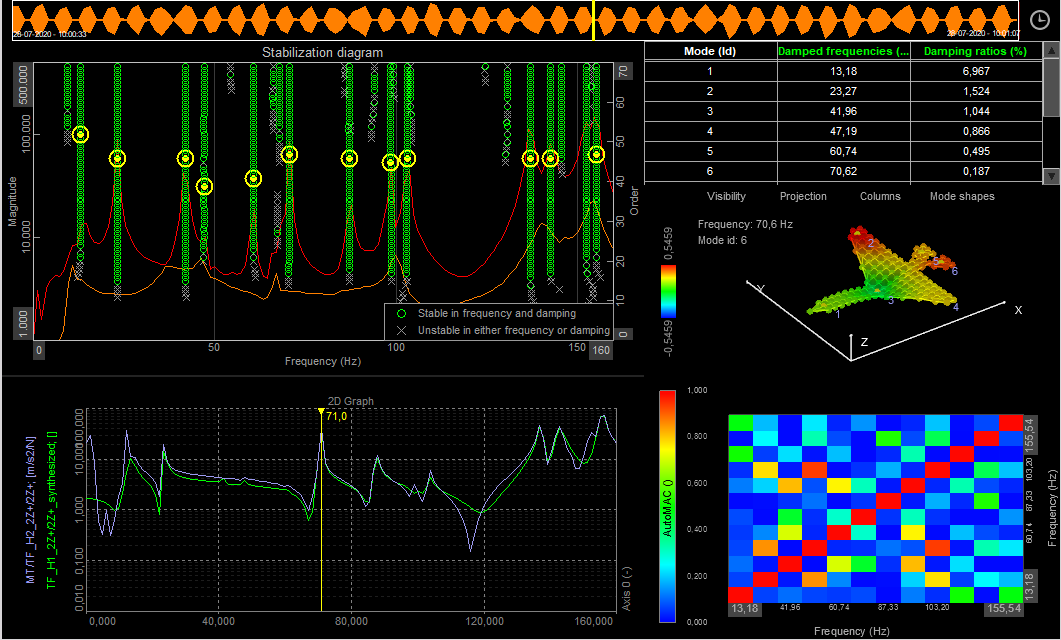
CMIF - Complex Mode Indicator Functions (CMIF), have one function for each reference DOF included (poly reference) and can detect closely coupled modes with repeated roots. CMIF is based on Singular Value Decomposition (SVD) of the FRF functions to identify all modes included in the model test measurements. The CMIF functions have peaks at resonances - indicating poles of the DUT.
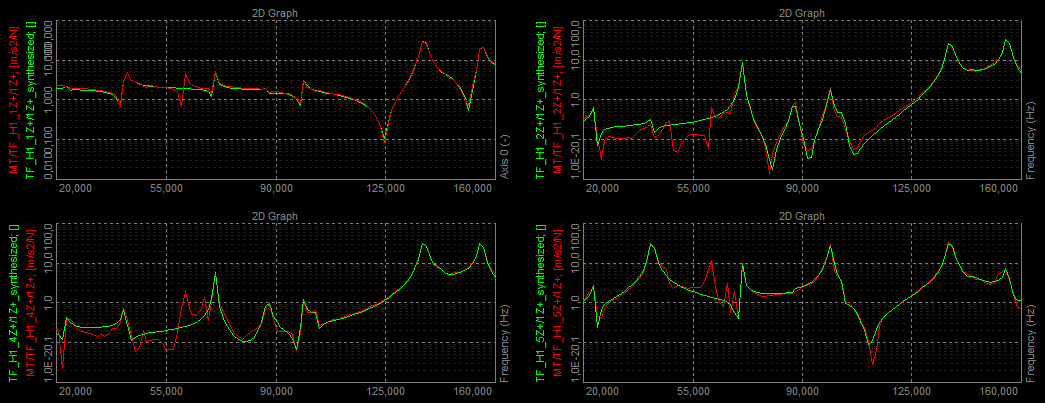
FRF synthesis - FRF Synthesis is used as a validation tool by comparing the FRFs from the estimated modal model (the synthesized FRFs) with the real measured FRF data.
Mode shapes - outputs the mode shapes for the included modes - based on the estimated modal parameters.
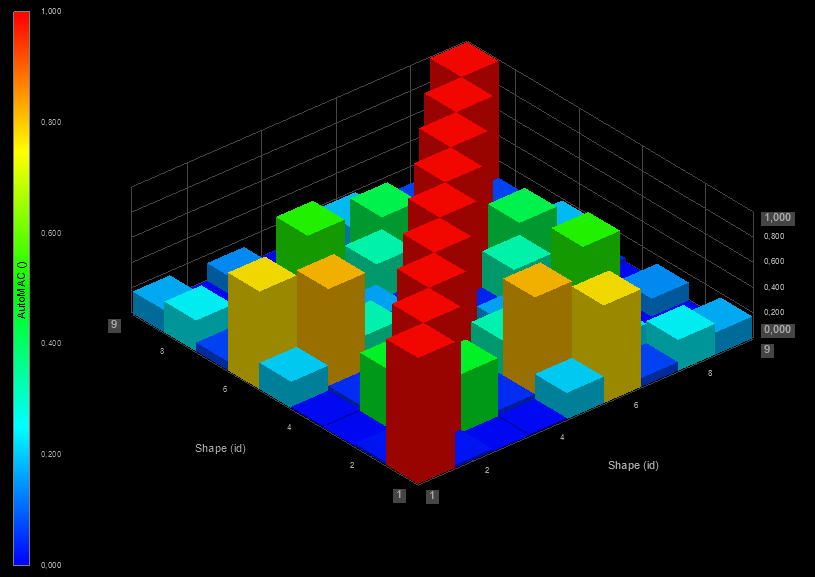
AutoMAC - The Modal Assurance Criterion (MAC) is used to determine the similarity of two mode shapes. “Auto” in AutoMAC means that the two mode shapes comes from the same test.
Results
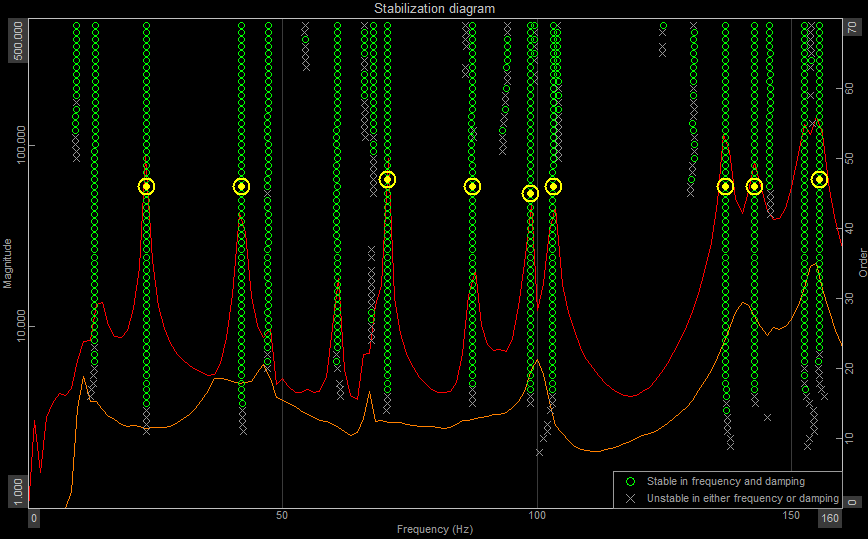
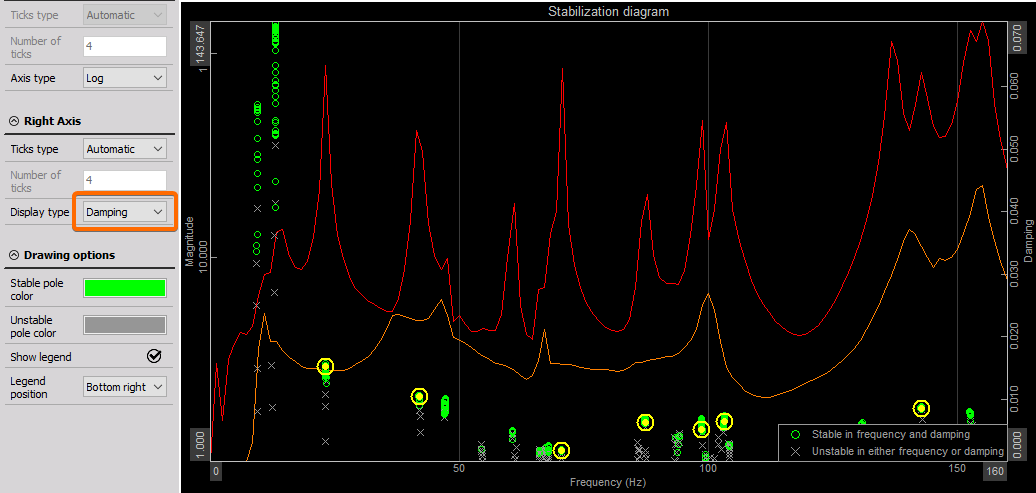
Stabilization Diagram
A Stabilization Diagram (or SD) helps with identifying stable poles and thereby consistent modes. The poles consist of the modal frequency and damping.
Display type:
order damping
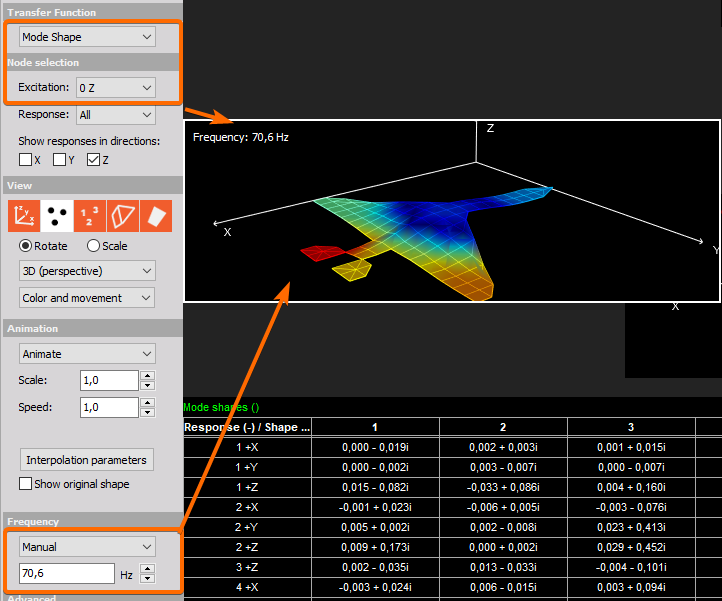
Animation of Mode Shapes
In order to animate a mode, select Mode Shape as a source for animation under Transfer function window.
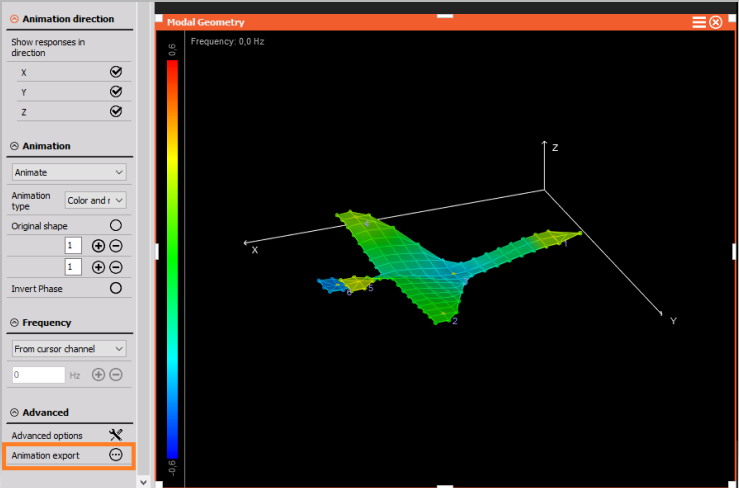
On the left side under the Advanced option, we added an animation export feature, where you can easily download avi. format of single loop of animation.
AutoMAC
The Modal Assurance Criterion Analysis (MAC) analysis is used to determine the similarity of two mode shapes:
If the mode shapes are identical (i.e., all points move the same) the MAC will have a value of one or 100%.
If the mode shapes are very different, the MAC value will be close to zero.
When a mode shape is compared to itself, the Modal Assurance Criterion value will be one or 100%.
FRF synthesis
FRF Synthesis is used as a validation tool by comparing the FRFs from the estimated modal model (the synthesized FRFs) with the real measured FRF data. Hereby it is possible to see how well the estimated model mimics the physical structure’s dynamics.
Merging Multiple Datafiles
If a modal test of a structure cannot be performed at once, multiple datafiles can be merged into a single datafile for easier identification of mode shapes, animation, etc.
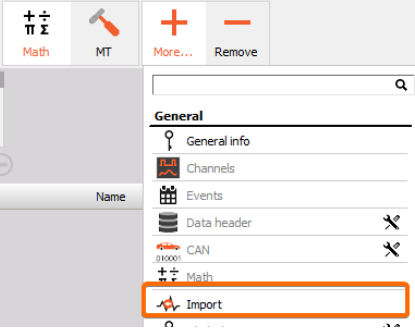
Open one of the datafiles and add the Import module to the setup in order to merge FRF functions from other datafiles to the current one.
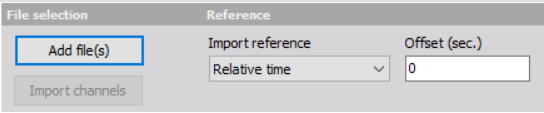
Add the datafiles that contain the transfer functions that you want to import. In the Import module select the datafiles containing FRF functions to import, by pressing ‘Add file(s)’.
We only need to import single value vectors (FRF functions) and not the whole time history. Search for the FRF transfer functions, set import to Yes and click the Import button.
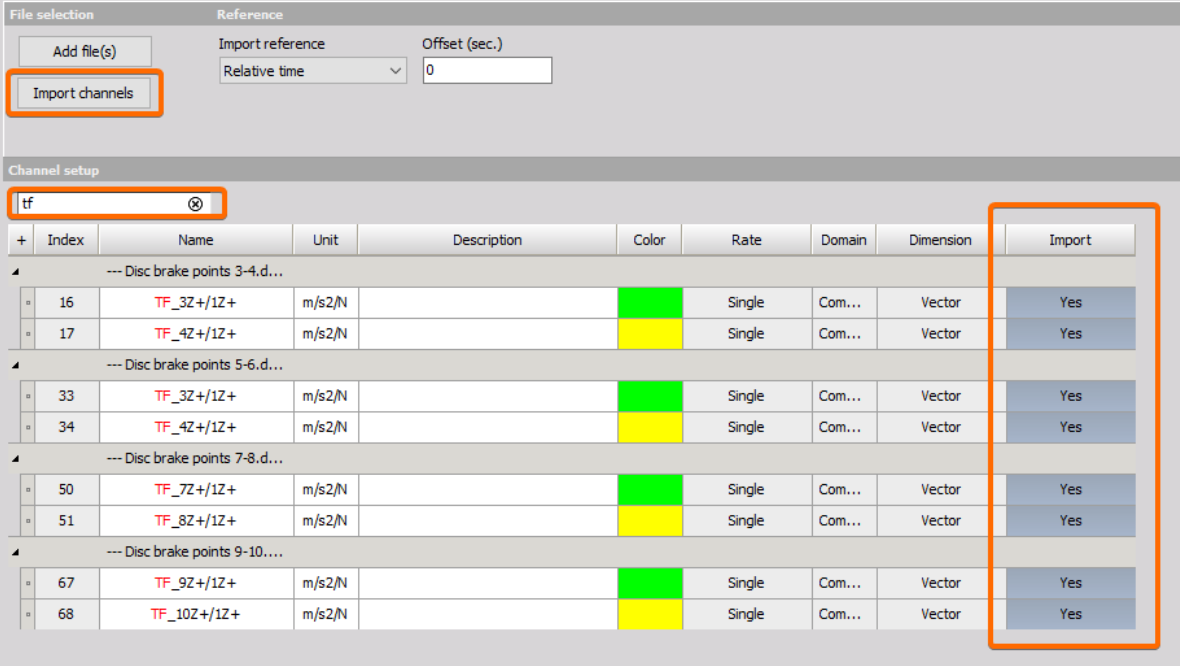
FRF transfer functions are found and selected to be imported. Hereafter, press ‘Import channels’.
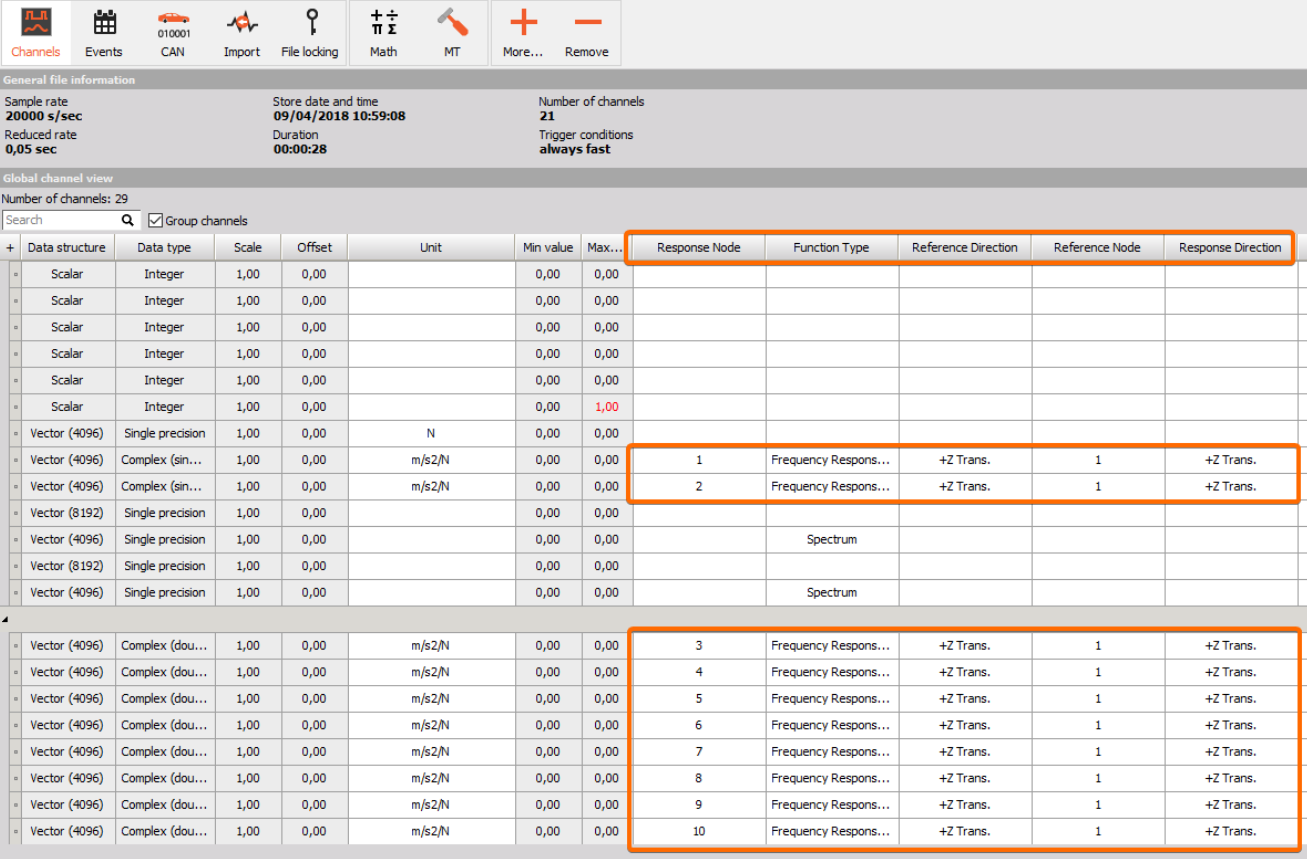
All the imported transfer functions have information about response- node and direction, function type, and reference- node and direction. If needed, then these parameters can be manually changed under the Channels section to match the actual modal test configuration.
After importing FRF functions from other datafiles, then go to the Channels tab and verify that all FRFs have the correct DOF information. If you can’t see the channels tap it can be added under ‘+ More’. If you do not find the DOF related columns in the Channels table, these columns can be added by right-clicking on the column header and selecting ‘Edit Columns’.
After the DOF parameters have been corrected for all actual and imported FRF functions, then they can be analyzed together as one big measurement.
For lighter analysis, this can be done by using the Modal test SDOF Modal Circle widget and looking at the animated deflection shapes.
For full analysis, this can be done by using the Modal analysis MDOF model estimation and looking at the animated mode shapes.