ORBIT ANALYSIS
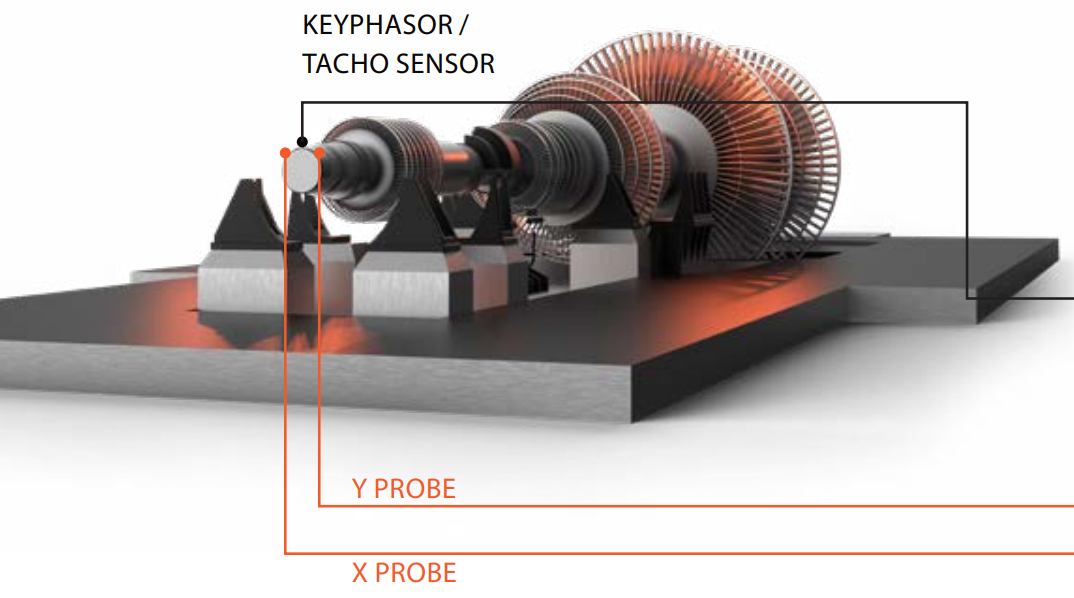
Orbit analysis is a necessary tool for vibration analysis of rotating machinery using journal bearings. The process is essentially an extension of time waveform analysis plotting time-domain data from a pair of displacement probes on an orbit graph with consideration for the physical location of the proximity probes.
This F1 manual is dedicated to setup and settings explanation, additional info about the Orbit Analysis module itself can be found in the PDF manual available on our download webpage —> Orbit analysis manual
Setup
In the channel setup section of the orbit analysis plugin applicable measurement parameters are set through a designated user interface. The settings are grouped into six major sections for easiness of use:
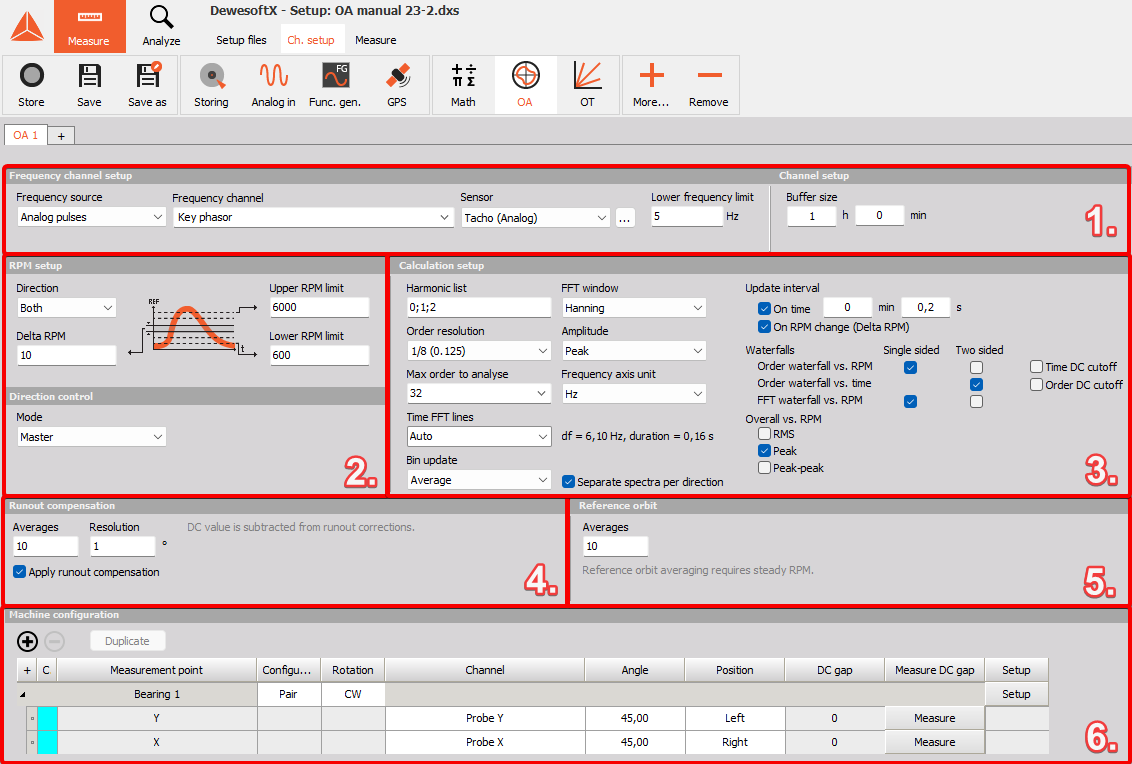
- Frequency channel setup
- RPM Setup
- Calculation Setup
- Runout compensation
- Reference orbit
- Machine configuration
1. Frequency channel setup
Under frequency channel section of setup, the type of frequency source is selected and the correct sensor is configured. The module supports different sources both analog and digital as well as direct input of the frequency channel

Frequency source: Counters, Analog pulses, RPM channel
Sensor: Tacho, Encoder, CDM, Geartooth, X-n sensors
Frequency channel: input channel with connected tacho/counter sensor
For typical Orbit Analysis application a third proximity probe, often called ”Keyphasor” is used. When Analog pulses frequency source is used, there will be an additional setup section that can be accessed via the three dotted icon as shown below:

By clicking on the icon, a setup for Angle Sensor Math will open as this math is used in order to detect the rotation frequency:
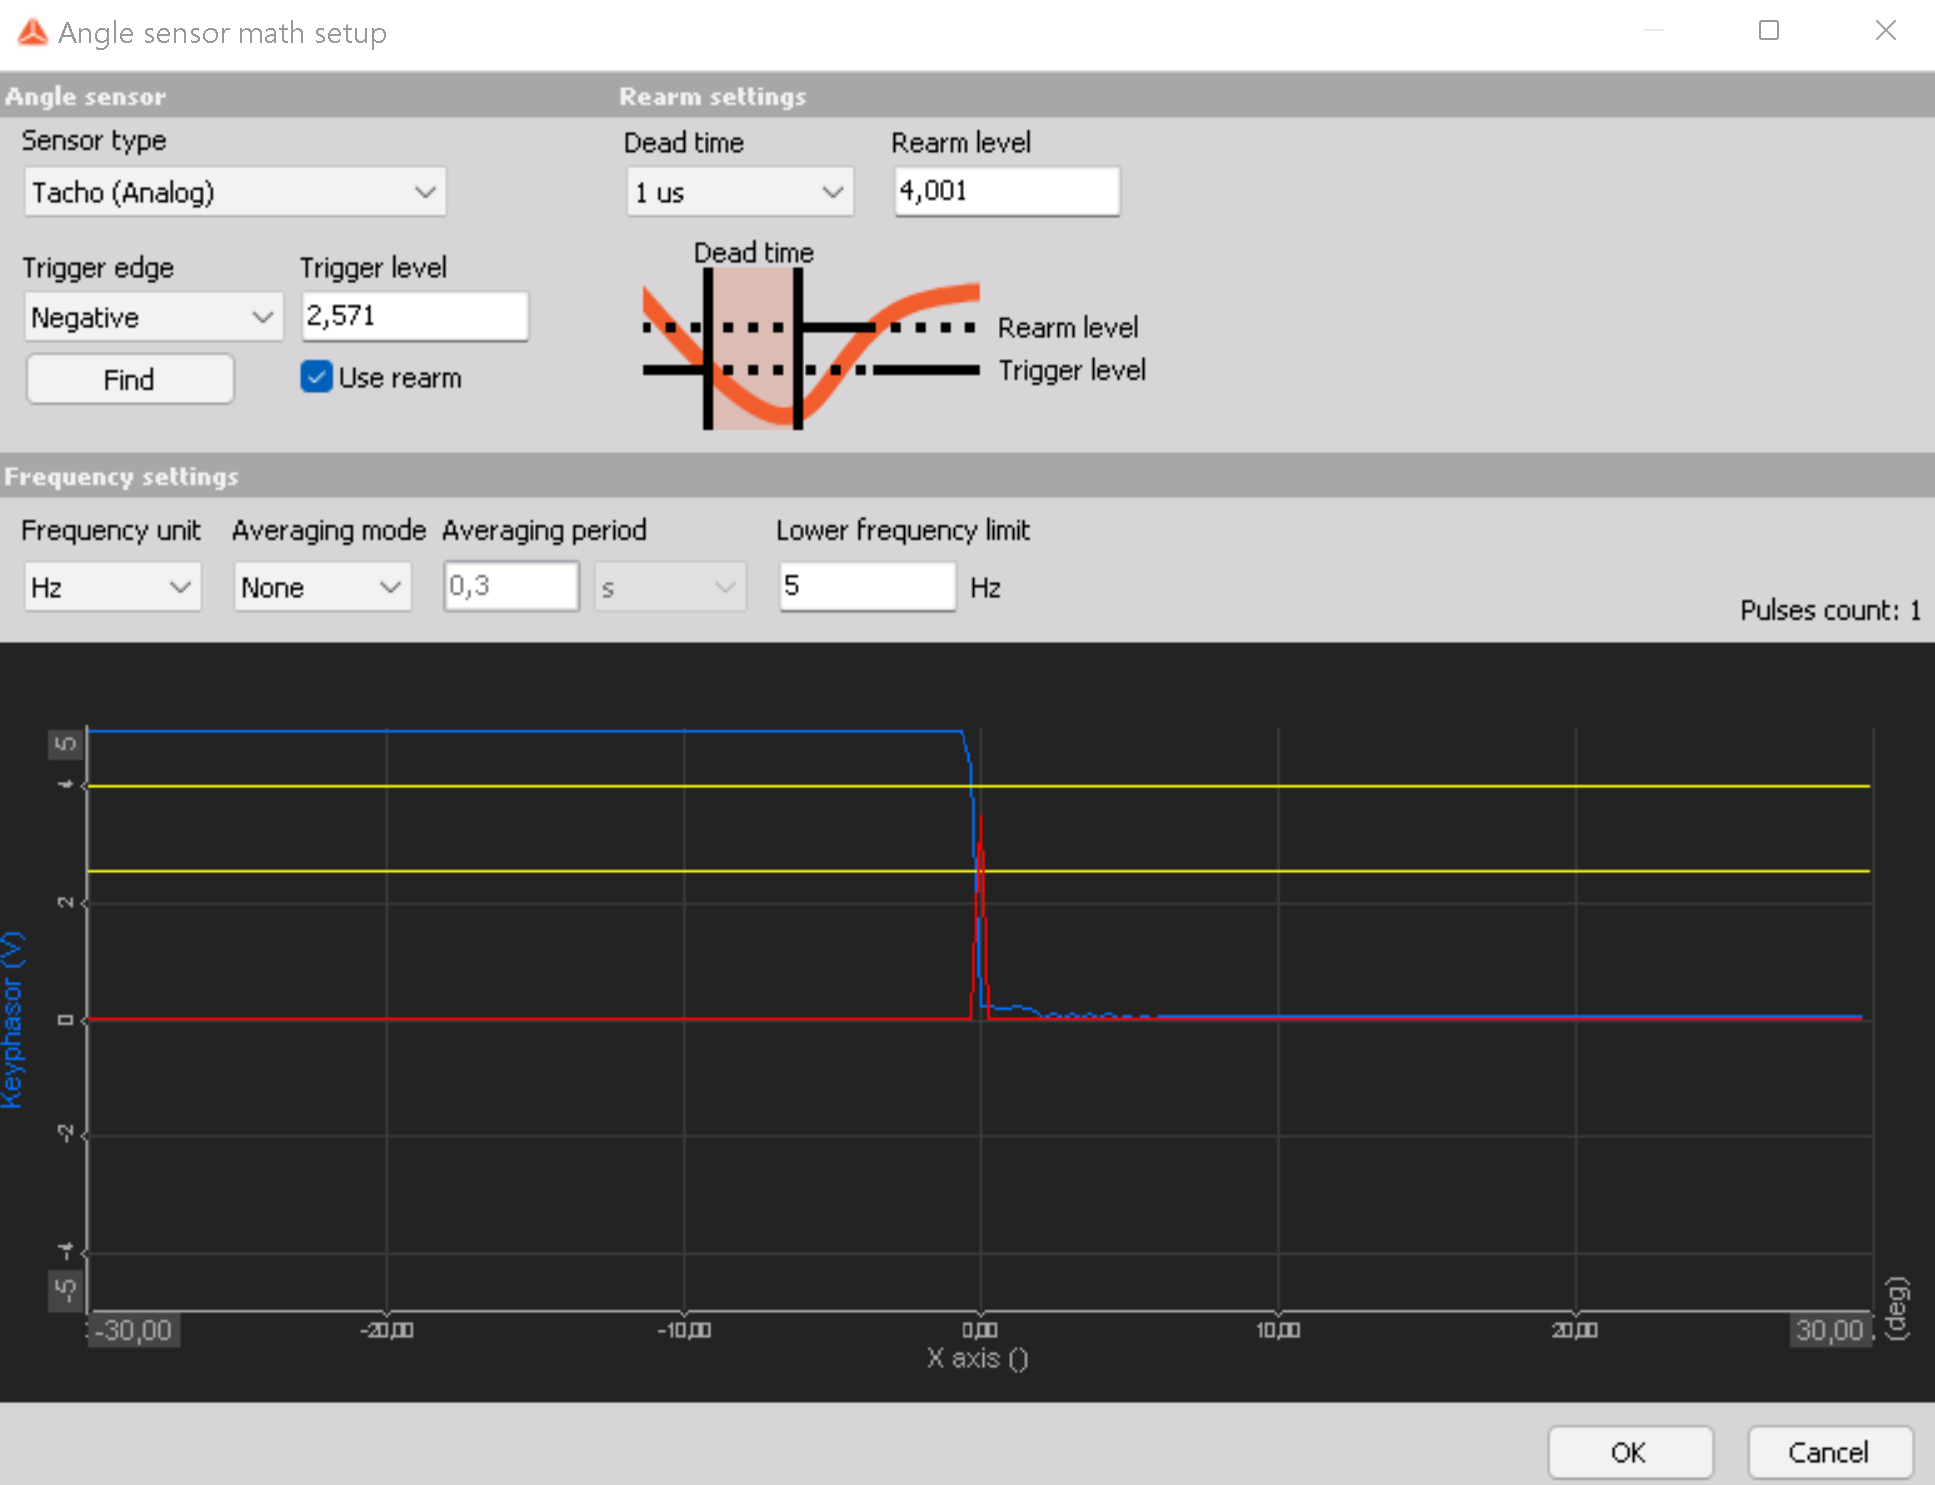
Further explanation of the above settings can be found in F1 manual section dedicated to Angle Sensor Math.
2. RPM setup and Direction control
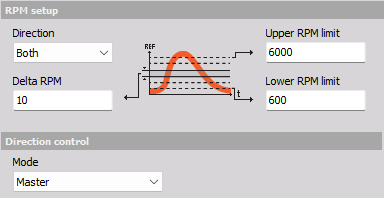
Under RPM setup section, lower and upper limits are defined as well as Delta RPM and the direction of the test.
Direction
Direction should be set after the speed profile used during the test. The speed Direction can be set to Runup, Coastdown or Both:
- Runup - will put runup related channels into Runup channel groups.
- Coastdown - will put coastdown related channels into Coastdown channel groups.
- Both - will put channels into three groups relating to Runup, Steady state, and Coastdown resuls. Selecting the Direction type Both will also create a Direction control channel. The Direction control channel is used under Measure and will determine to which of the channel groups (Runup, Steady state, or Coastdown) new data will be added. For example, while running a test in Runup mode data will be added to output channels under the Runup channel groups. If you change the Direction to Coastdown then direction dependent data will now instead begin to be added to output channels under the Coastdown groups.
Delta RPM
Delta RPM sets the speed bin width and hereby the RPM resolution. Data is calculated for each speed interval between Lower and Upper RPM limit. The lower the value the higher the resolution and the more CPU power needed.
Upper & Lower RPM limit
Type in the desired Lower and Upper speed limits. This will be used on results that have a speed axes. The Lower and Upper RPM limits should include the full speed range of the measured rotor.
Direction control
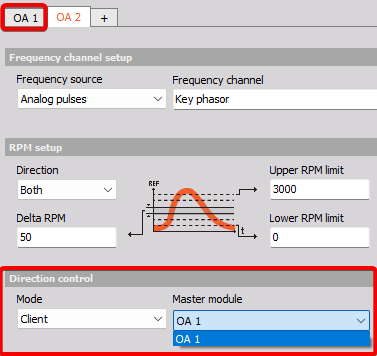
This makes it possible to control the Direction under Measure for multiple Orbit Analysis modules at the same time. In setups with multiple added Orbit Analysis modules and at the same time using the Direction Both, you can select to link the Direction control together instead of having to change the Direction for each module individually.
The Mode parameter can be set to Master or Client. For Clients you must select which Master it should be linked to.
For example, if module OA1 is Master and module OA2 is client to OA1, then these to module are linked and Direction changes under Measure for one of them will also apply the same change to the other one:
3. Calculation setup
Calculation parameters are set up under the following section, such as: list of desired harmonics, type of FFT window, resolution and update settings.

Harmonic list: input desired harmonics for calculation (e.g. 0, 1, 2).
Order resolution: 1, 1/2 , 1/4 , 1/8 , 1/16, 1/32, 1/64.
Max order to analyse user selects the highest order to be included in the analysis. If set to lower than 32, this needs to be configured also in Options\Settings\Extensions\Order tracking.
Time FFT lines: supports Auto, predefined values selection from dropdown or arbitrary definition of number of lines. Affects the FFT cascade output, higher number of lines results in better resolution and higher CPU load.
Bin update: is used to define how the output data for each RPM speed bin is calculated.
You can select the following Bin update types:
- Always - When multiple values or spectra belong to the same bin, then the newest bin values will overwrite previous values and the newest values will be used in the output for that bin.
- First time - When multiple values or spectra belong to the same bin, then only the first bin values will be used in the output for that bin.
- Average - When multiple values or spectra belong to the same bin, then averaging for the values and individual and spectral lines will be performed over all values belonging to that bin.
- Maximum - When multiple values or spectra belong to the same bin, then the maximum value for all values and individual spectral lines across all spectra belonging to that bin will be kept.
FFT window: Blackman, Rectangular, Hanning, Hamming, Flat top, Triangle.
Amplitude: toggle amplitute to be displayed on bode & polar plot.
Frequency axis unit: user selects the desired units for frequency axis - Hz or CPM.
Separate spectra per direction: will create the selected spectral channels under all Directions channel groups. When disabled the spectral results will be combined over all directions.
All possible Orbit Analysis outputs are listed under the Output list section at the end of the document.
4. Runout compensation
Runout compensation measurements can be made to remove/compensate for the general defection deviations appearing around each revolution.

Runout compensation can be measured online while the machine is running by manually pressing the Start button on the Measure tab under the display template called OA -> Runout compensation.
Alternatively, after the measurement is finished the runout compensation can be determined under Analyze by setting lockable cursors around the relevant data and press Recalculate:
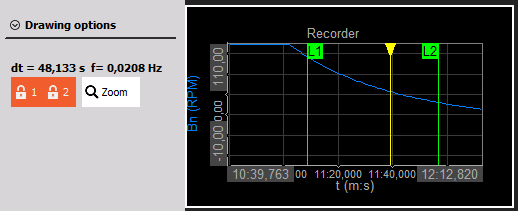
After measuring runout compensations the determined values are illustrated under the Bearing Setup section
To setup the runout compensation measurement the following parameters should be set:
- Average - Determines how many times the deflections at individual angles are averaged together. With an increasing number of averages also the measurement time required is increaed due to the need for more revolutions in the calculation.
- Resolution - determines how many angle points used to specify the runout compensation data. 1 degree resolution will give 360 data points for specifying a full rotation.
NOTE: Runout compensations exclude the DC component in order to be independent to speed variations that causes the shaft centerline to move.
5. Reference orbit
With the same workflow as performing runout compensation measurements it is possible to take reference orbit measurements which can be used as a base for when comparing orbit measurements taken under different conditions.

- Averages - specifies how many times the deflections at individual angles are averaged together.
- Lockable cursor calculation - Used when calculating runout compensations and reference orbits in Analyze mode (post-processing). Set this parameter to the desired calculation type in order to use the correct lockable cursors.
After measuring reference orbits the determined values can be illustrated under the Bearing Setup section after pressing the Paste button. The data will be added to the selected reference orbit table:

6. Machine configuration
Machine configuration setup can be further broken down into three subsections:

1 - Quick settings: selection between Pair/Mono configuration of proximity probes, clockwise or counterclockwise(CW/CWW) shaft rotation direction, assignment of the input channel to which proximity probes are connected as well as their Angle and Position.
2 - Measure: by pressing this button, DC gap is measured and compensated for
3 - Setup: opens additional settings for the bearing, further explained in the following section
By clicking on the + button, additional bearings are added to the machine train.

All bearings in the same machine train use the same frequency source so this configuration is suitable for measuring bearings on the same shaft or shafts with the same gearing.
If you measure on multiple bearings that are located on different shafts where each has its own rotating frequency this can be configured by adding another instance of Orbit Analysis module and assigning the corresponding frequency source.

In such cases, each shaft needs its own sensor as a frequency source or alternatively, if the gearing is known, the tacho for the subsequent shafts can be derived from mathematical multiplication or reduction of the tacho signal from the first shaft.

Bearing setup
When selecting Setup subsection, a pop up dialogue appears with advanced bearing setup options.
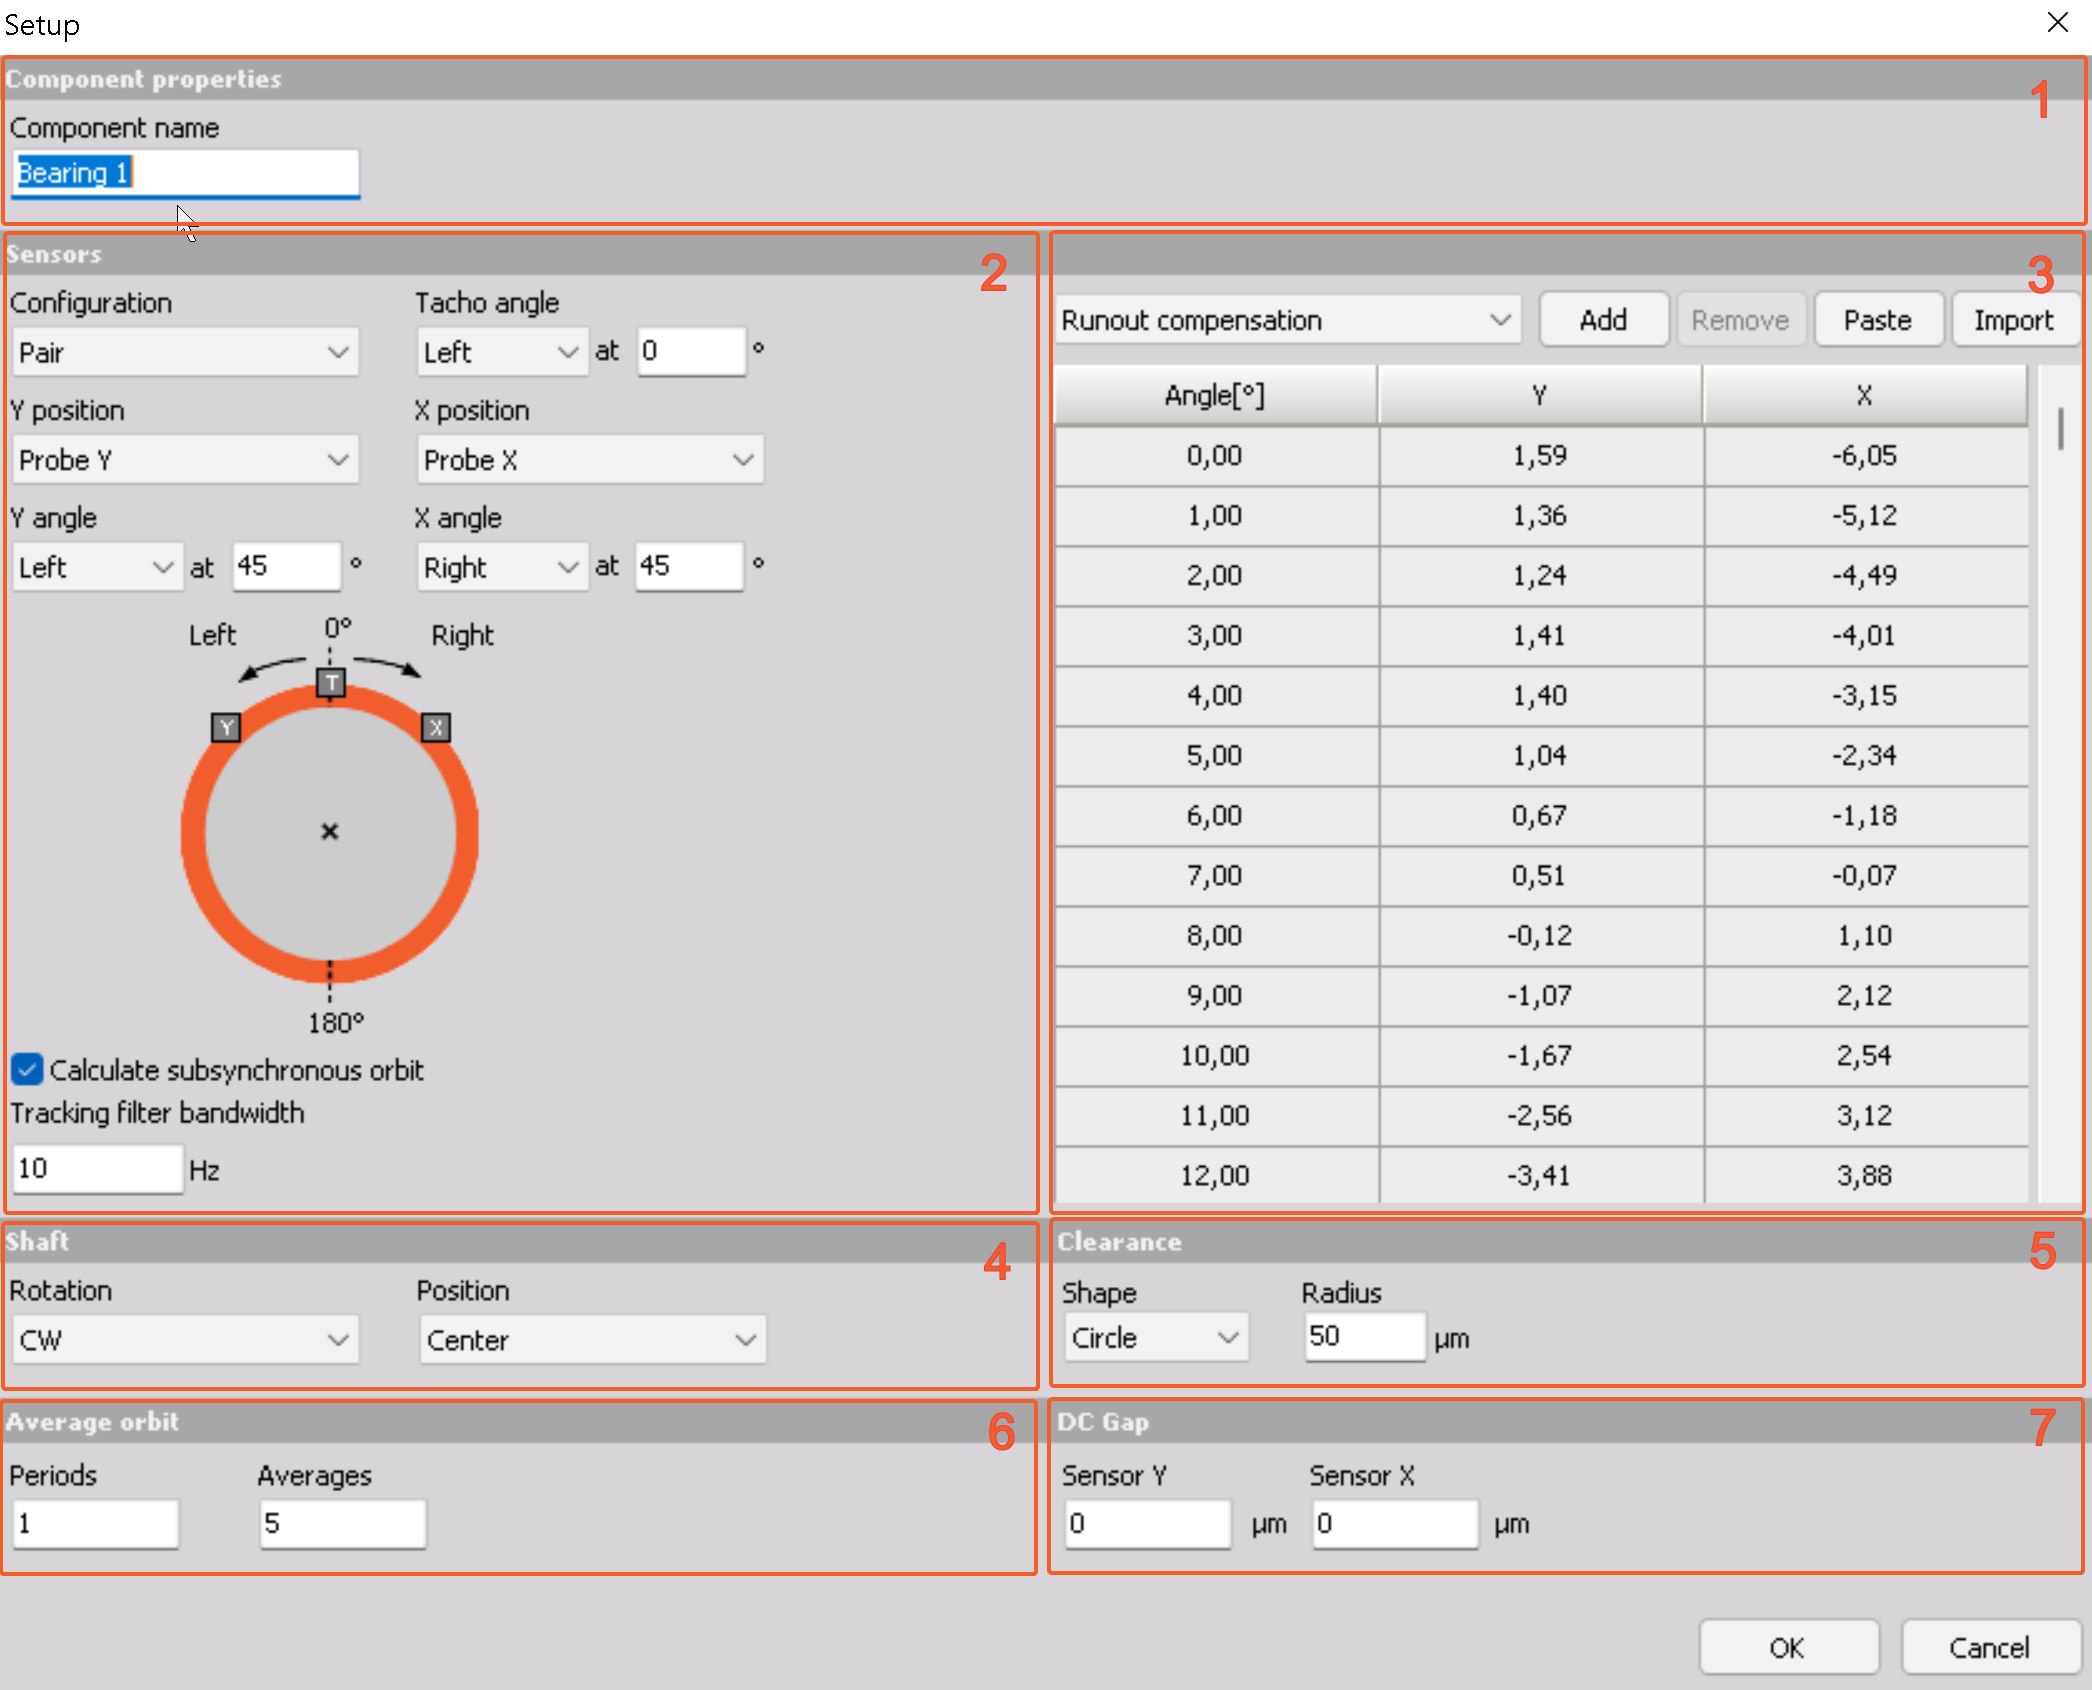
1 - Component properties: input field for user defined name, typically corresponding to the measured bearing
2 - Sensors: expansion of Quick Settings with visual representation of set parameters. This section is dedicated to configuring the proximity probes and tacho - position, angle and assignement of input channels to which the sensors are connected.
3 - Runout compensation and reference orbit: : dedicated dropdown for selection and definition of runout compensation or reference orbit. input data into the designated table or simply paste/import it from elsewhere.
4 - Shaft: set shaft rotation direction(CW-clockwise, CWW-counterclockwise) and starting position
5 - Clearance: select clearance circle shape(circle or ellipse) and input its size
6 - Average orbit: define number of periods shown and averages taken into the average orbit calculation
7 - DC Gap manually input DC Gap if the value is known and does not need to be measured
Measurement
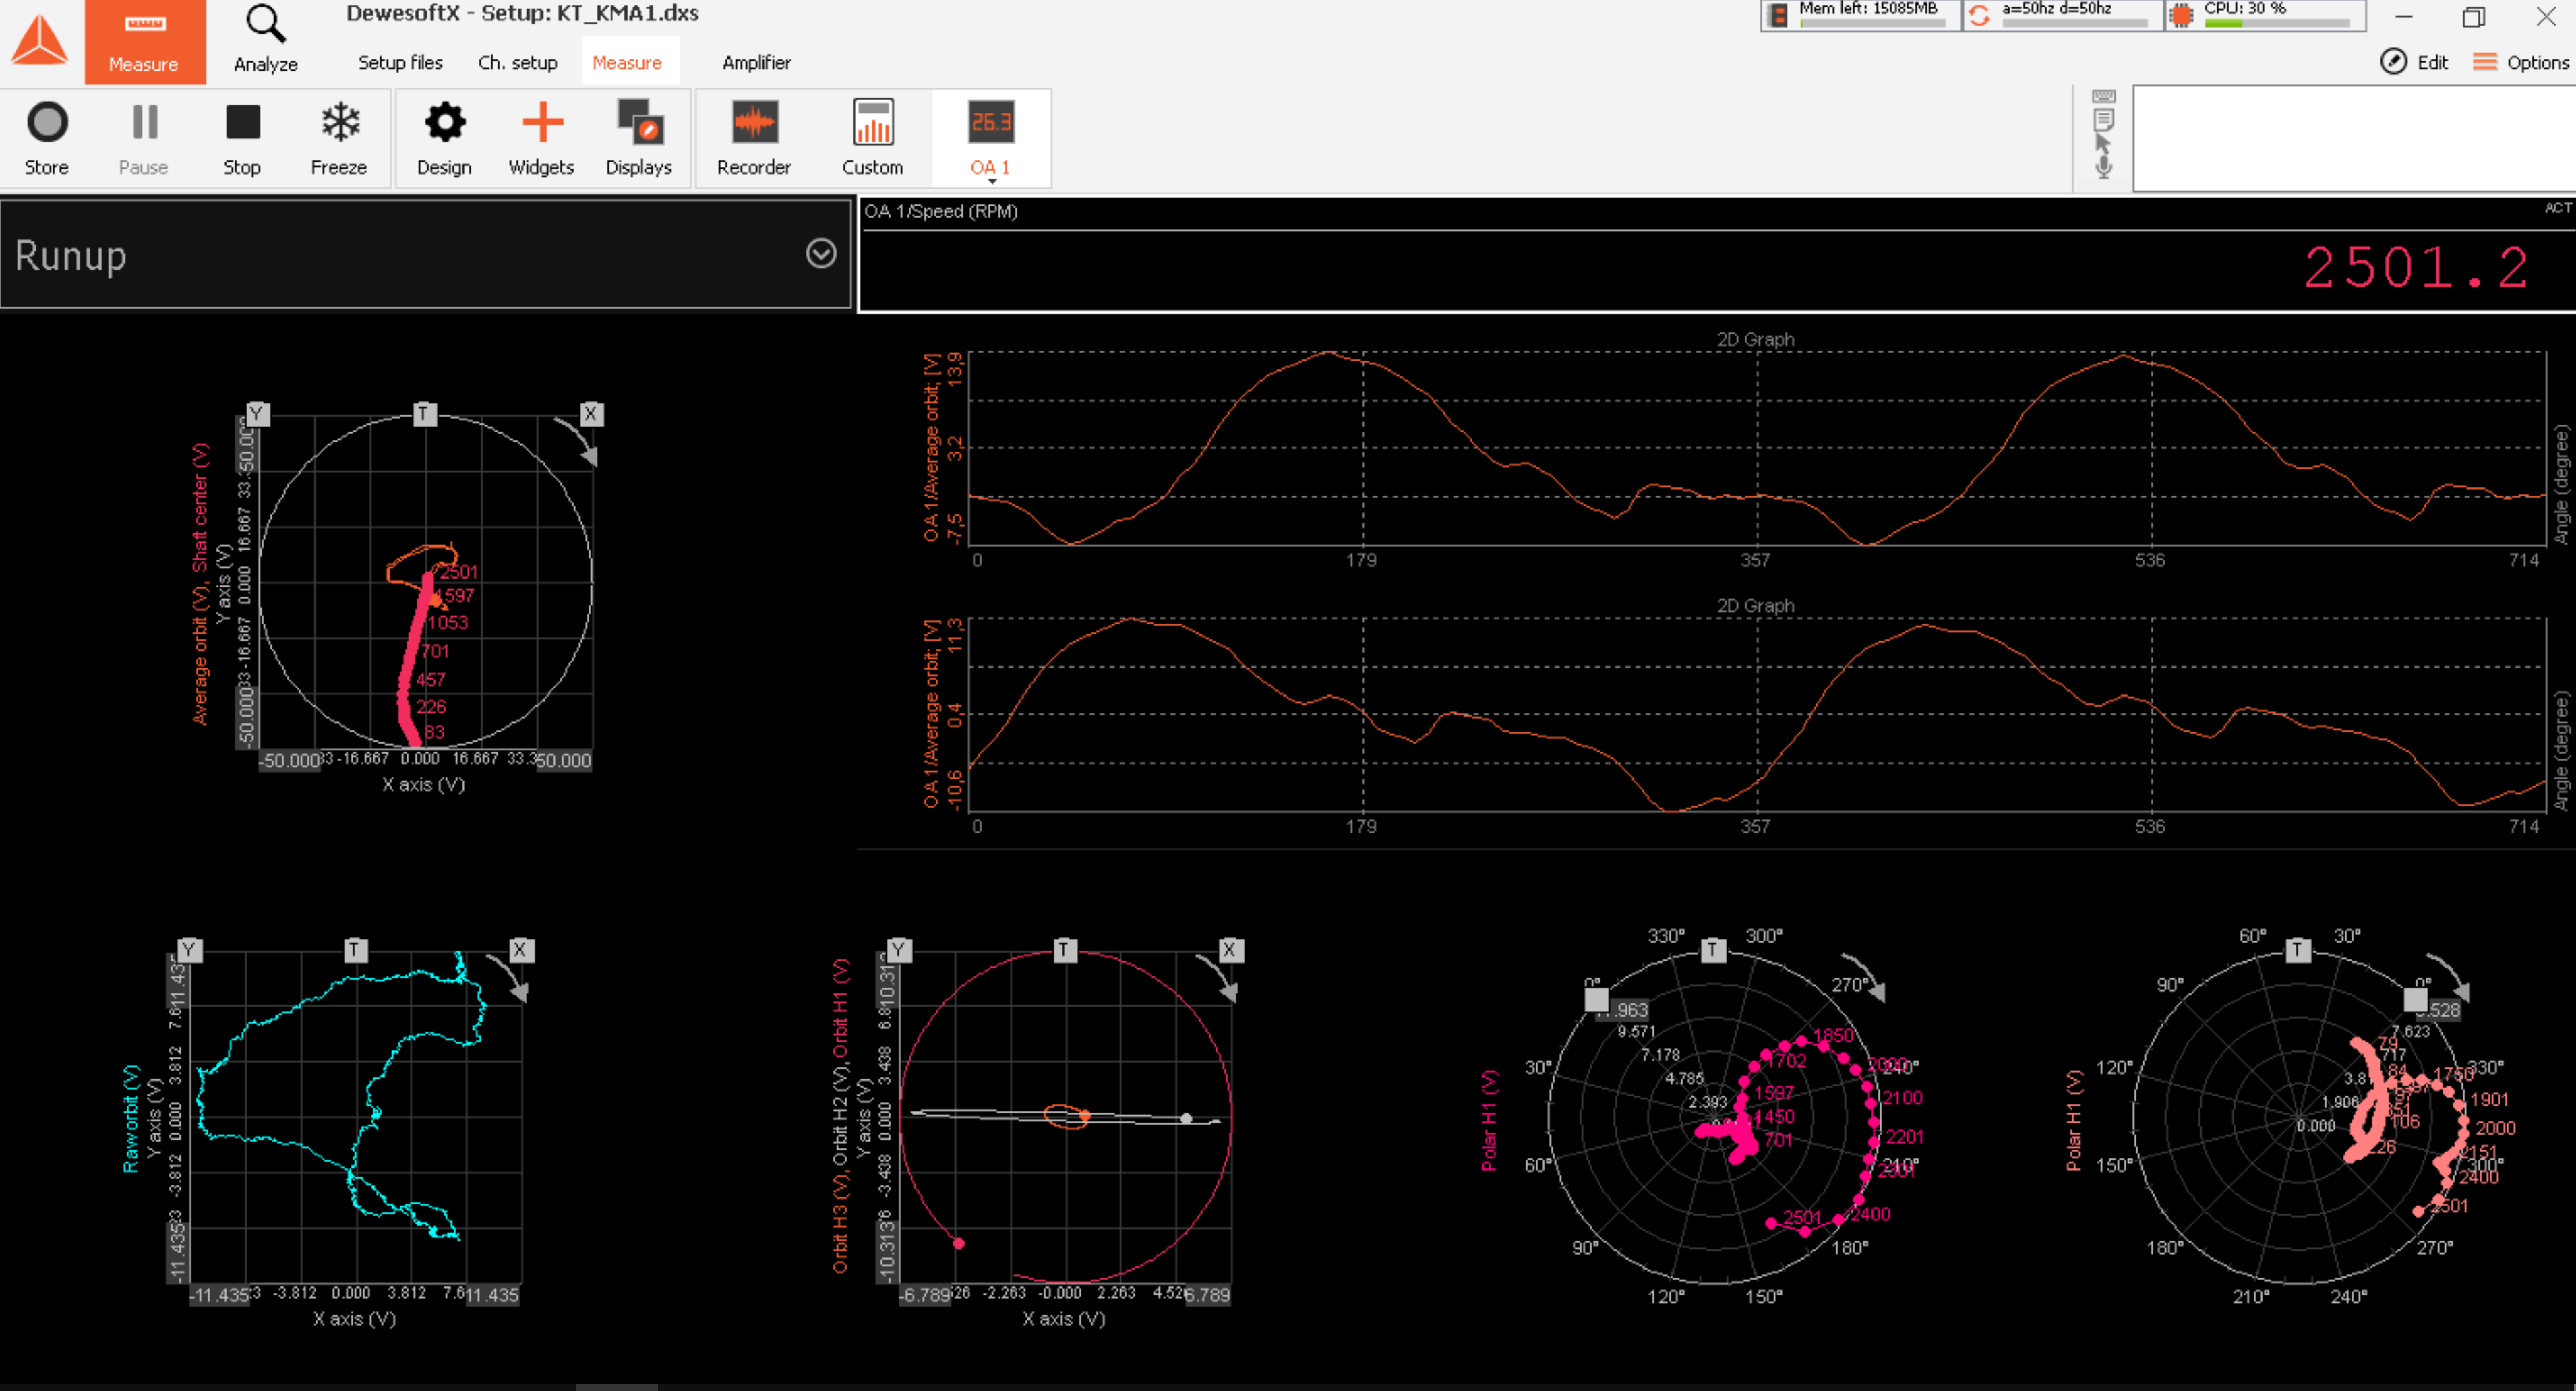
Orbit analysis comes with a set of designated widgets needed for precise analysis and representation of results. These widgets can easily be configured to show standard parameter combinations used in orbit analysis. Different standard displays are further elaborated in the following section.
As with any other Dewesoft module, additional inputs can be easily added and shown on the same or different display. Below is an example of Orbit Analysis measurement display.
Orbit analysis widgets
Below is a list of typical displays used in orbit analysis that can easily be created using predefined display widgets within Dewesoft Orbit Analysis.
Some of the used display widgets are specifically design for monitoring and analysis of shaft vibrations in journal bearings. Such widgets are e.g.:
More detailed information about these widgets are found in the links above.
Many other general widgets are also used for Orbit analysis such as:
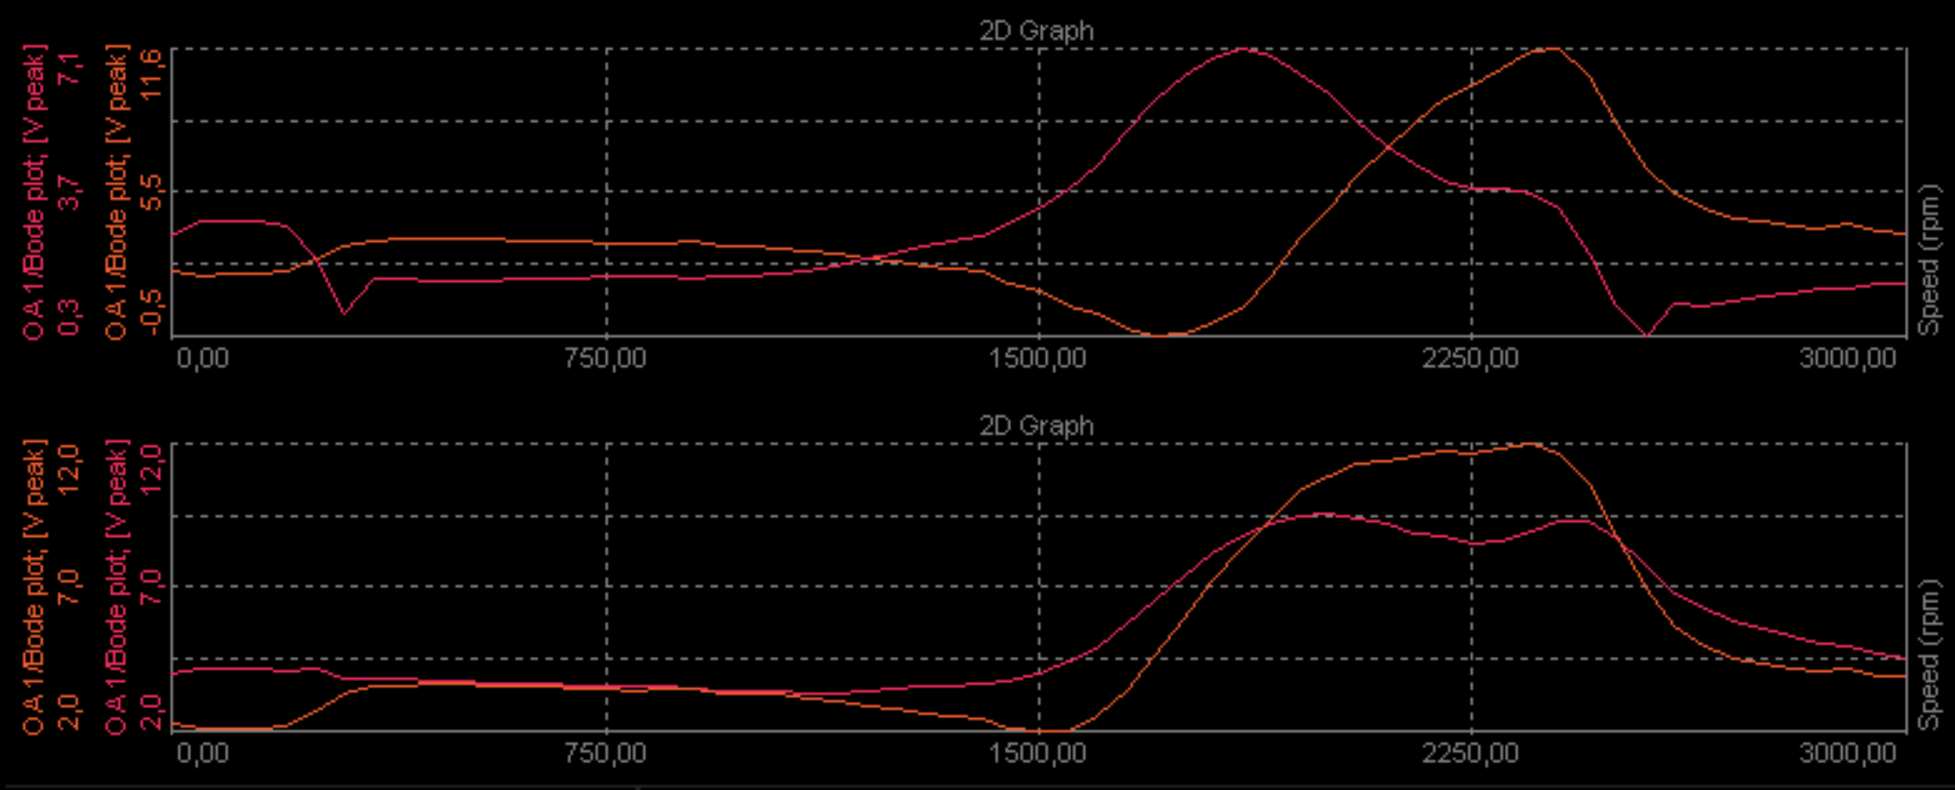
2D graph - for Bode plots, 3D graph - for Waterfalls, Recorder - for Time history, and Digital meter - for Scalar values
Raw orbit with clearance circle
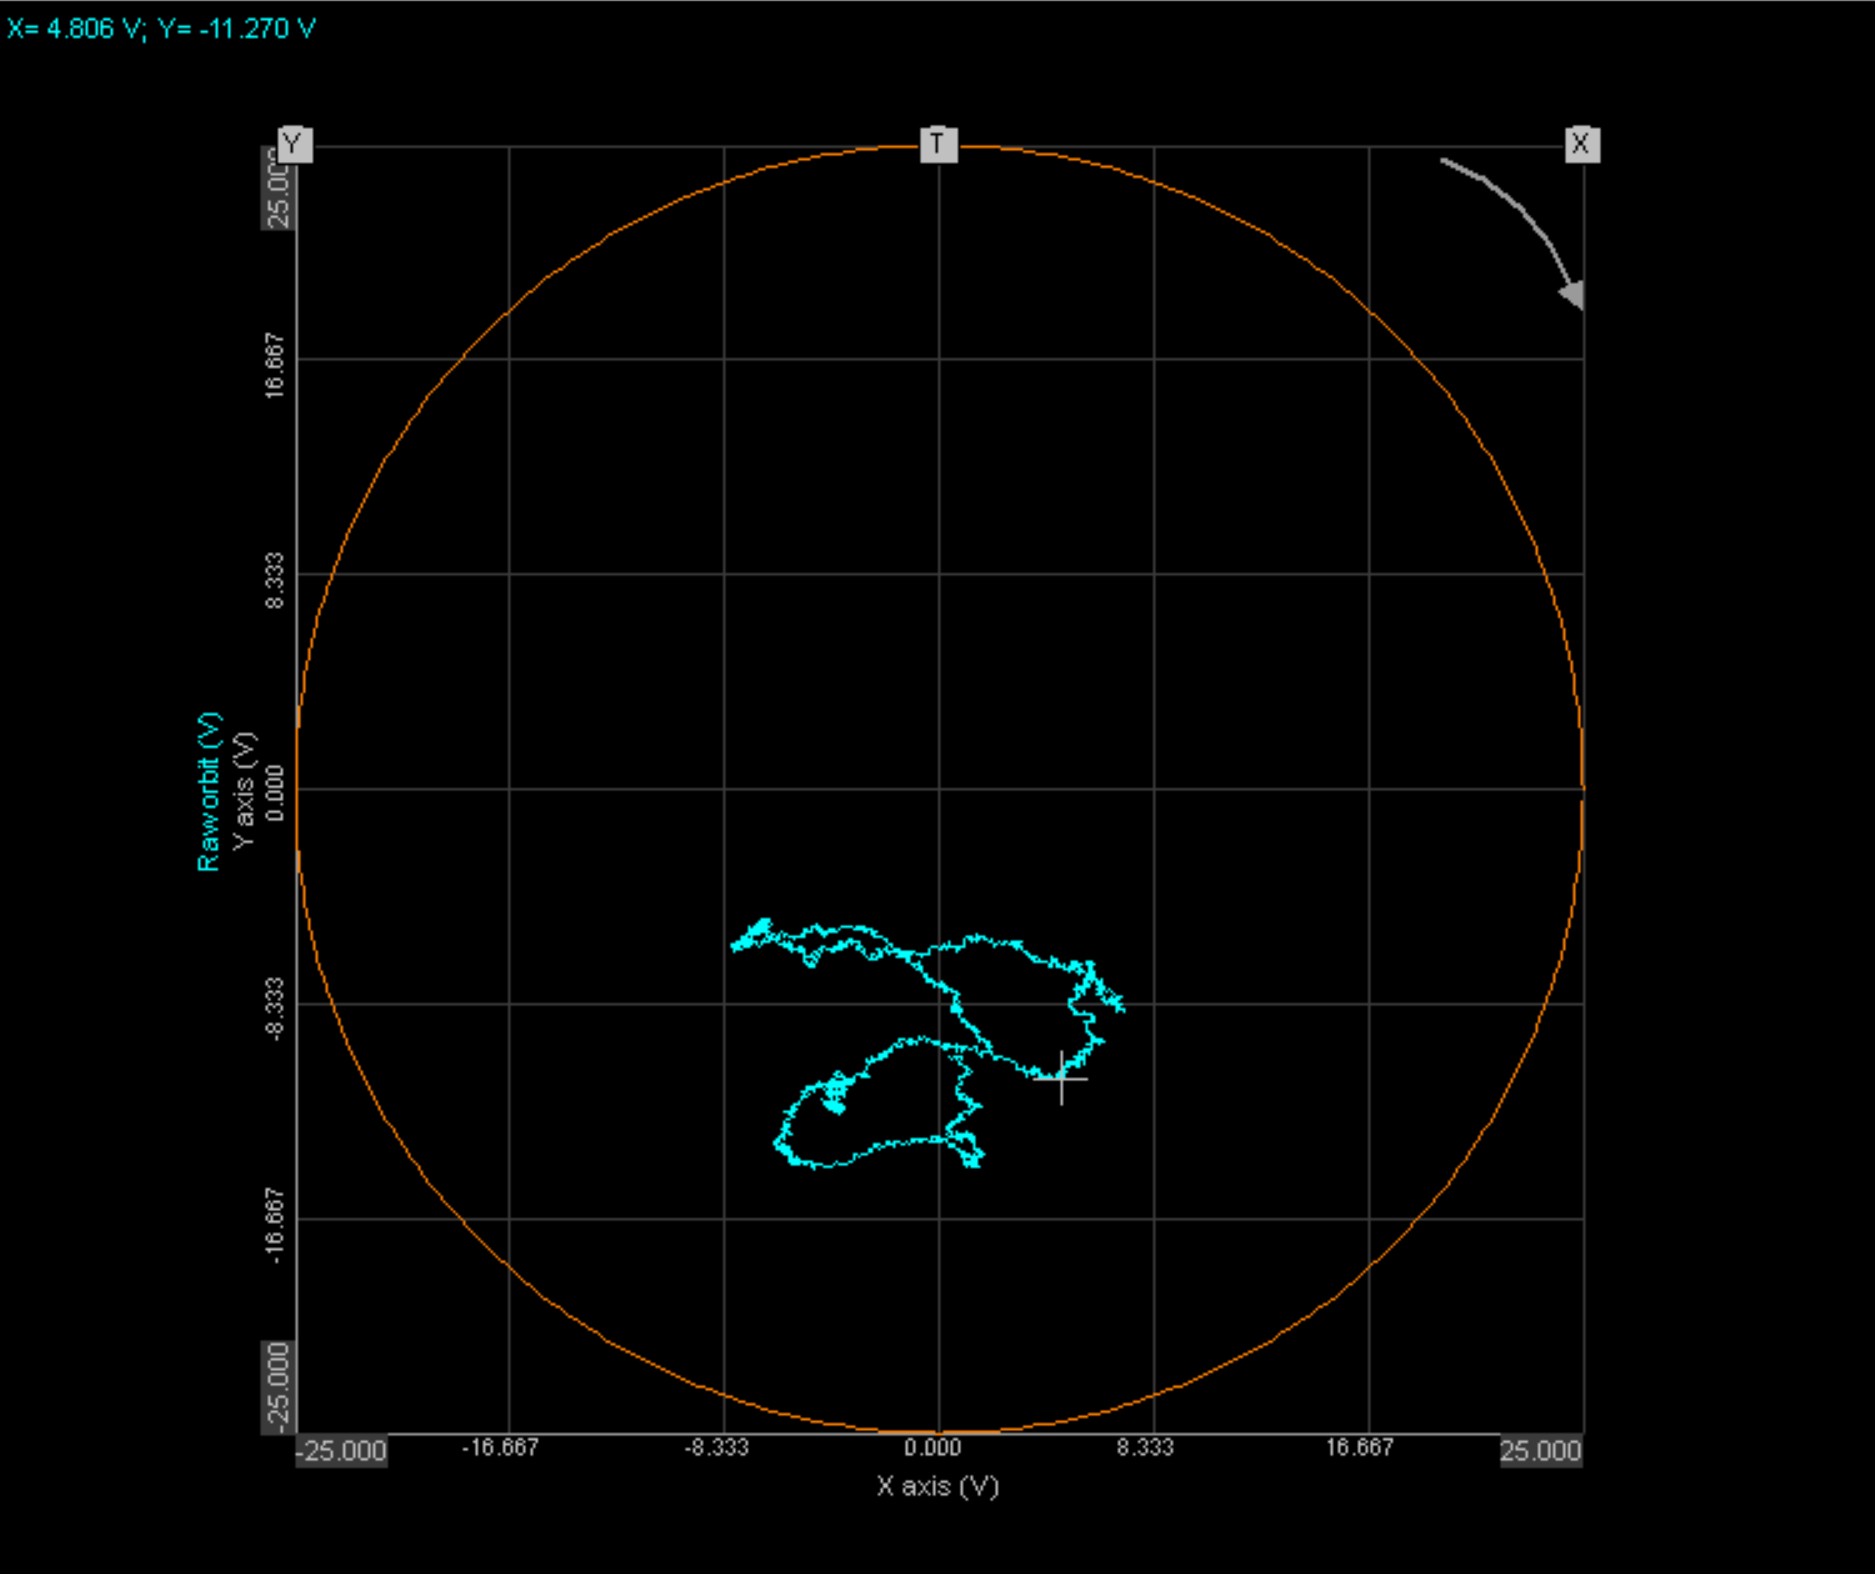
In the predefined measurment display there are two Orbit plot widgets by default and on any of the two, Raw Orbit can be displayed. To switch on also the clearance circle, please select the Clearance checkbox under Drawing Options on the left side of the screen:
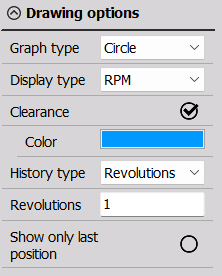
Raw orbit is seen in turquoise on the graph with clearance circle in orange.
X and Y mark the position of proximity probes, whereas T marks the tacho’s position.
Rotation direction is also shown on the graph with an arrow.
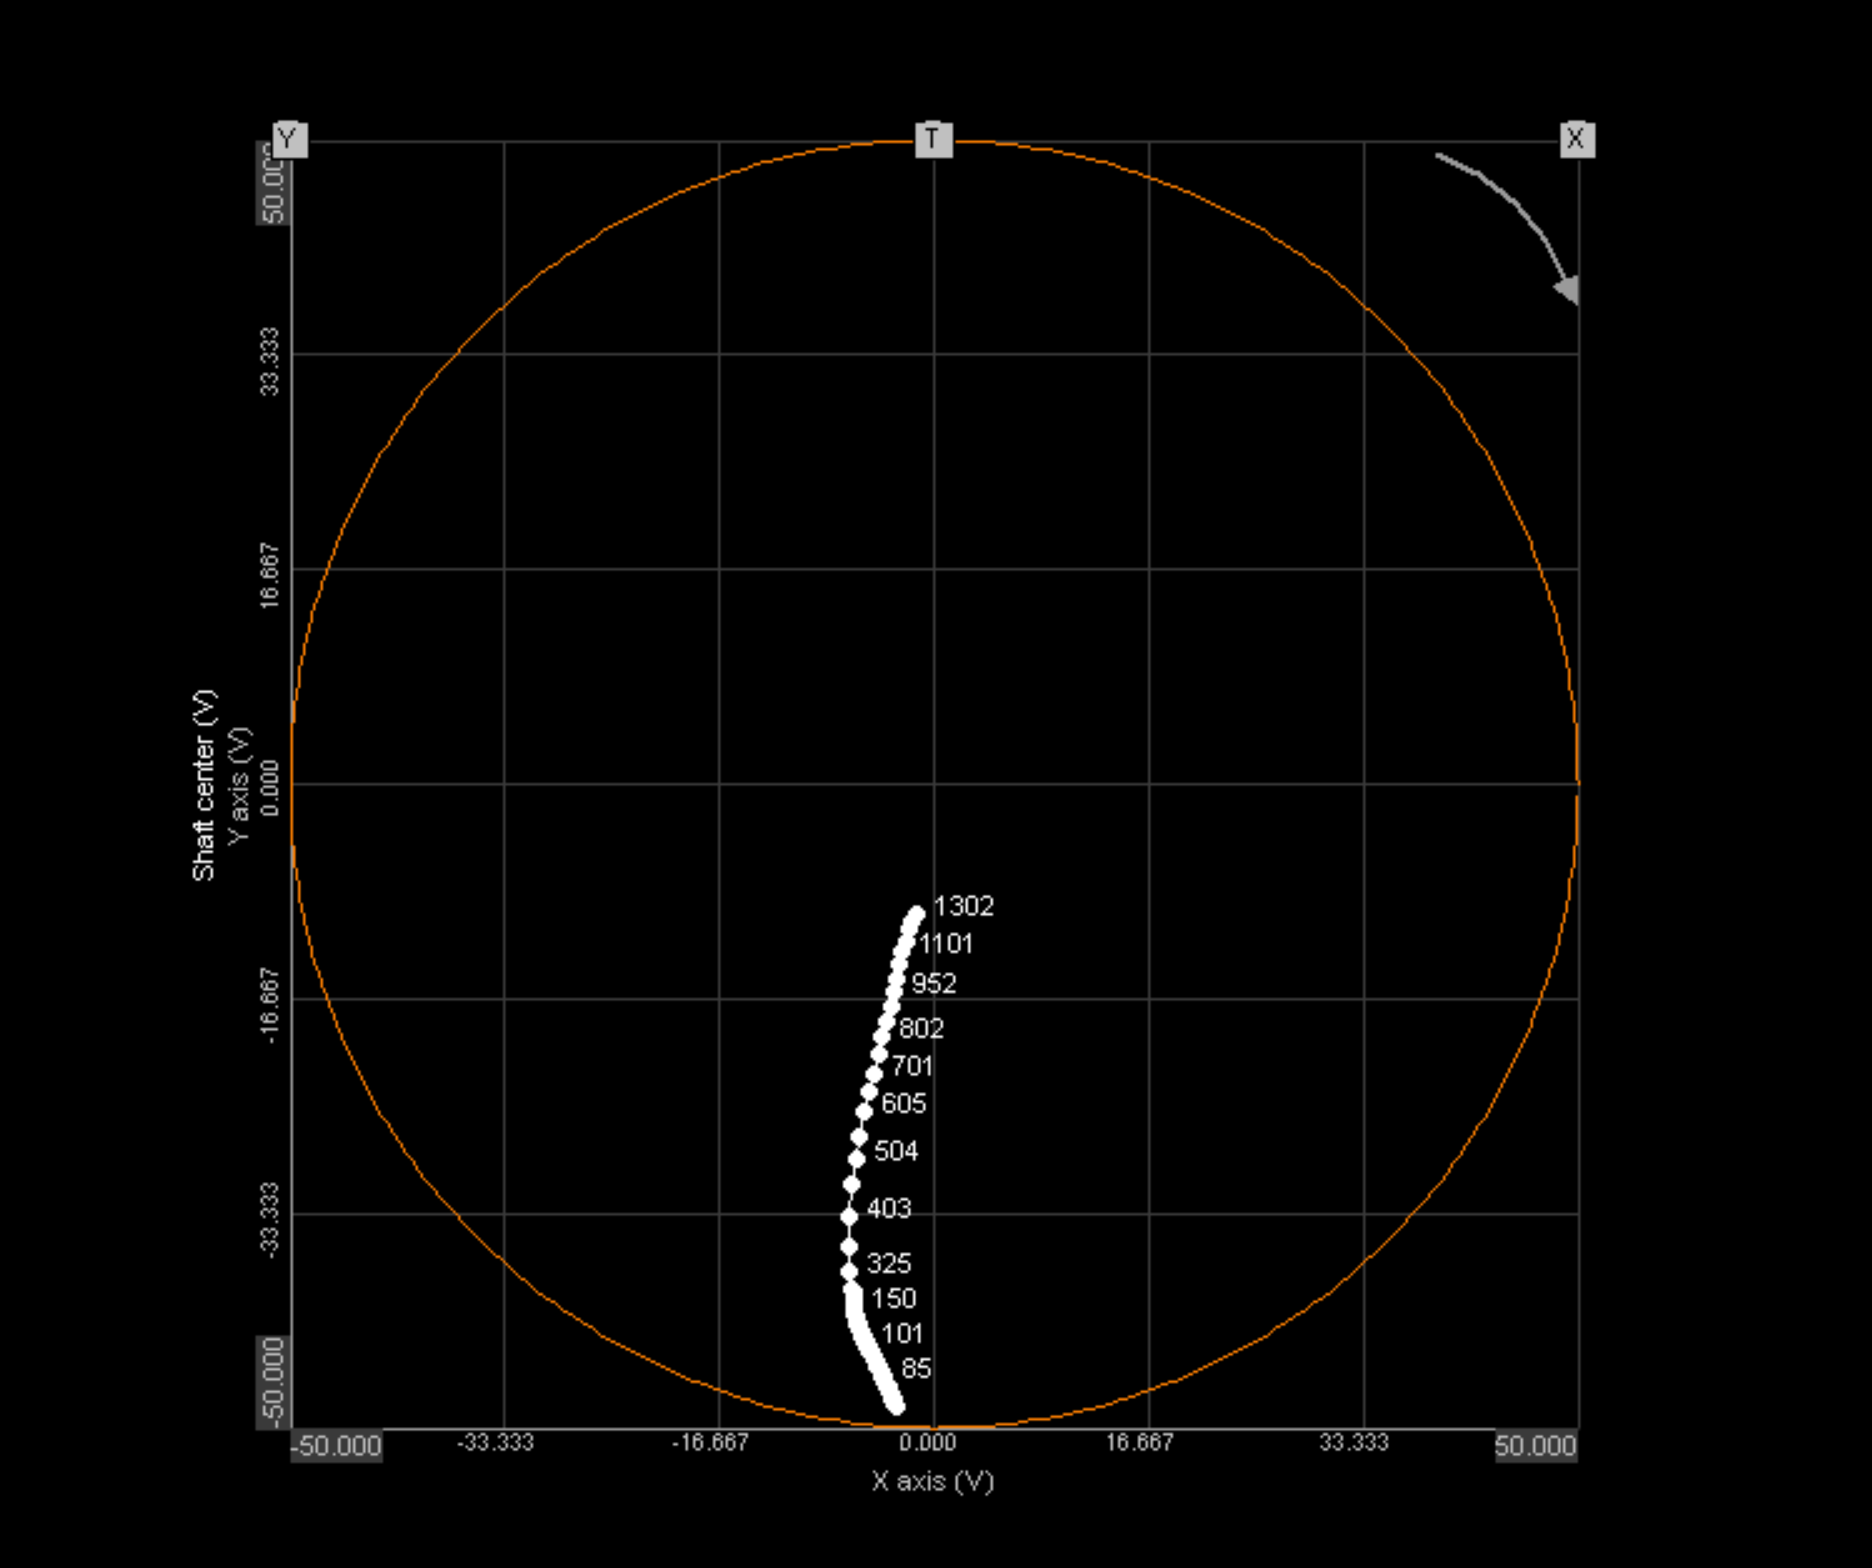
Shaft centerline with clearance circle
Displayed on Orbit Plot, by assigning Shaft Center to it and switching on Clearance in the left side settings tab for Orbit Plot.
Shows shaft centerline movement in white vs. RPM inside the clearance circle.
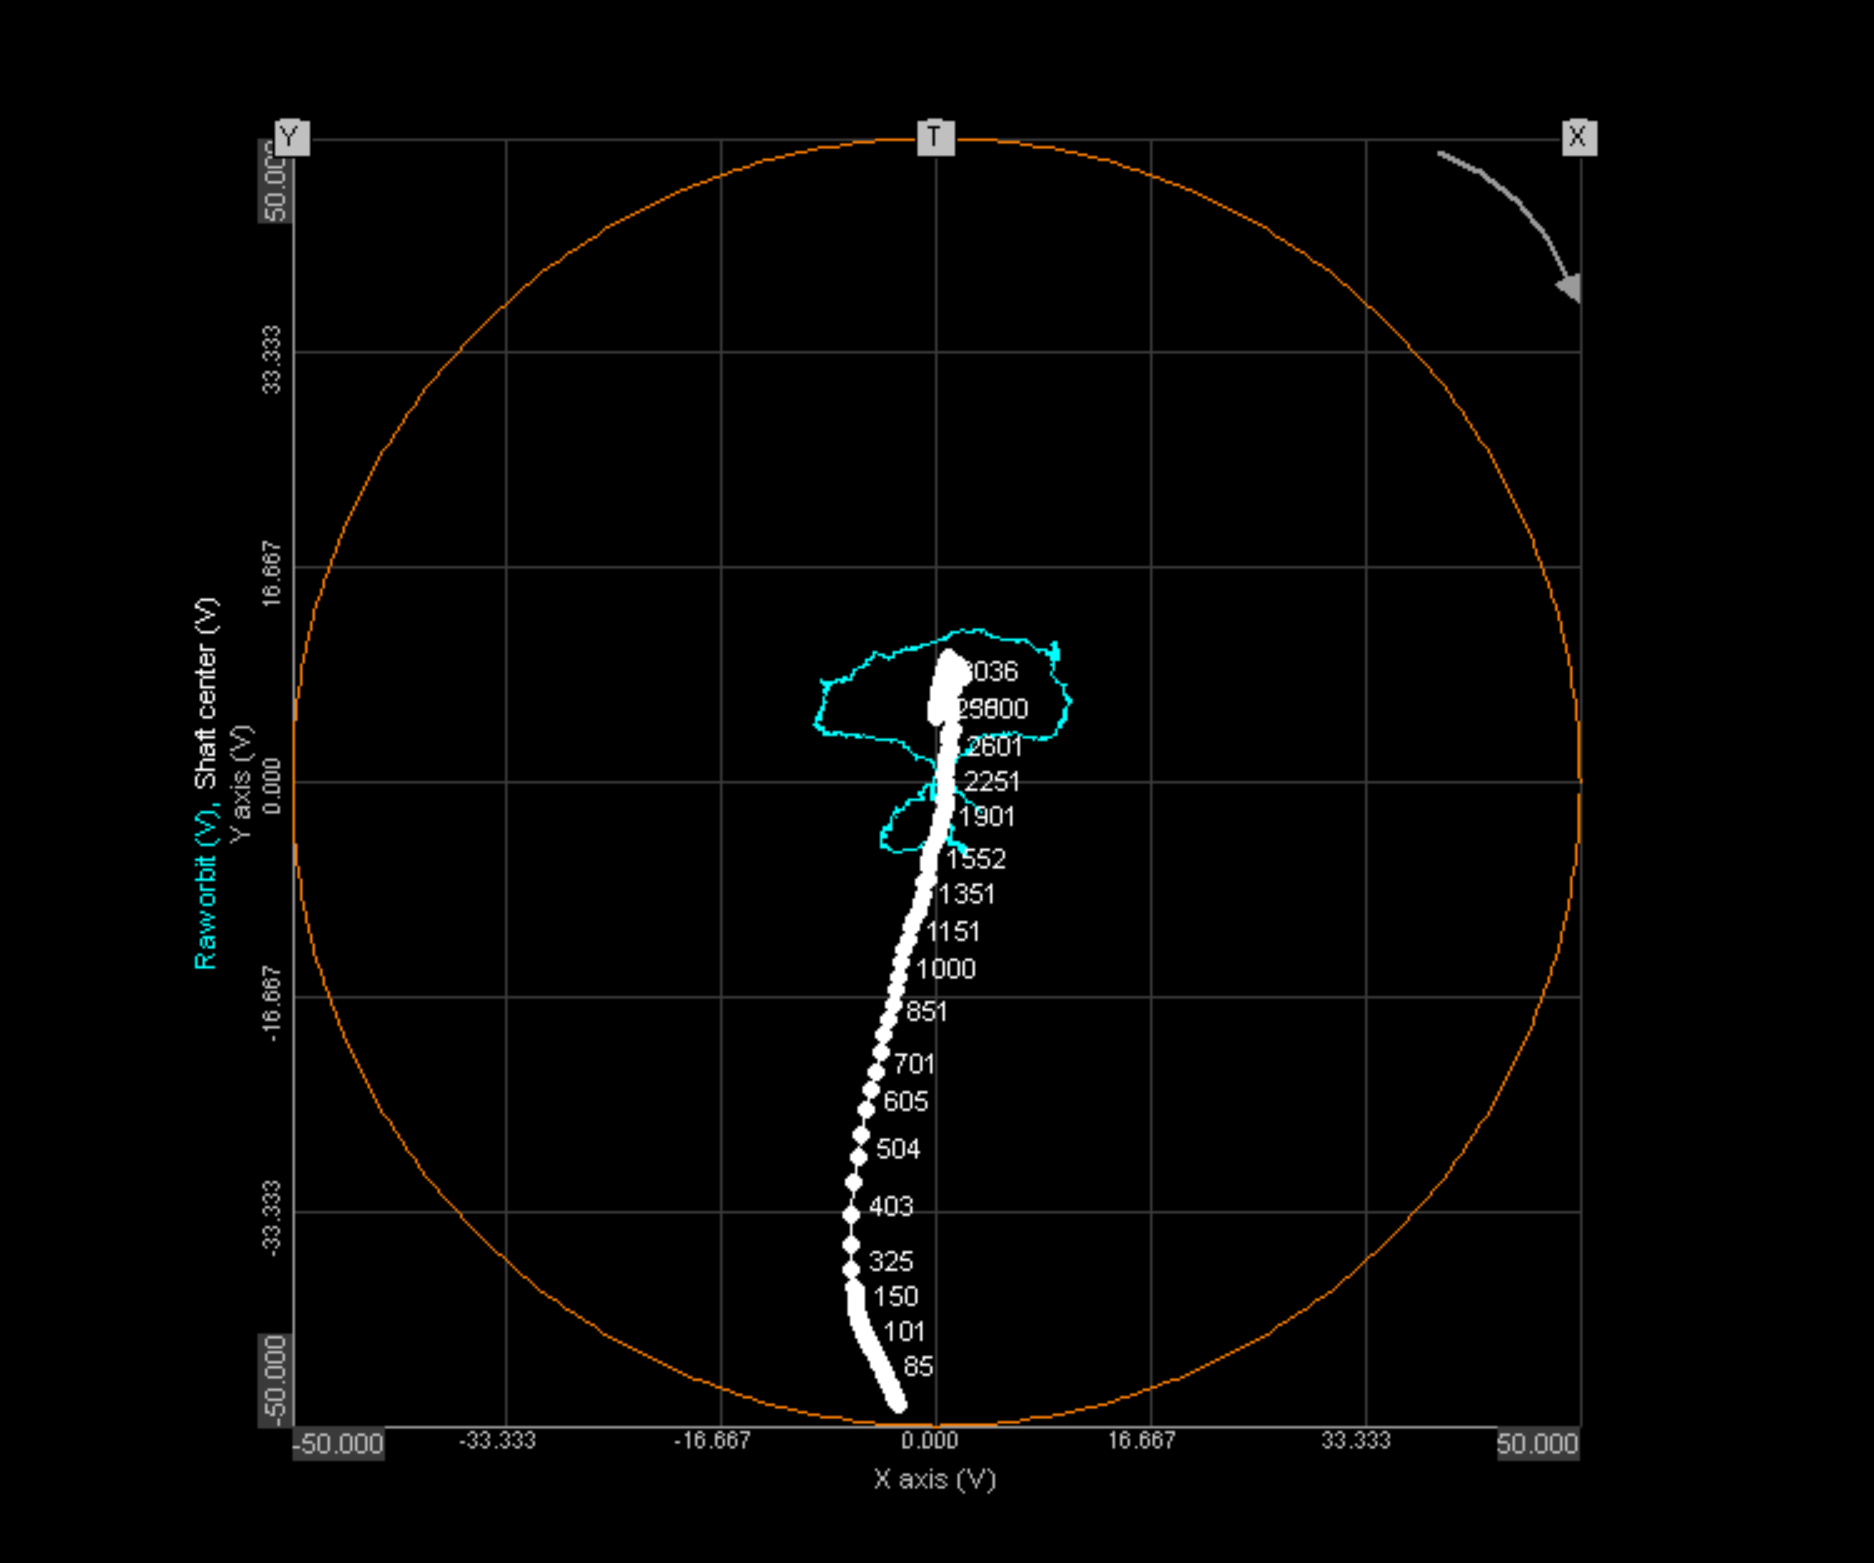
Full motion graph
Full motion graph consists shows Shaft centerline, Clearance circle and Raw orbit on the same display widget.
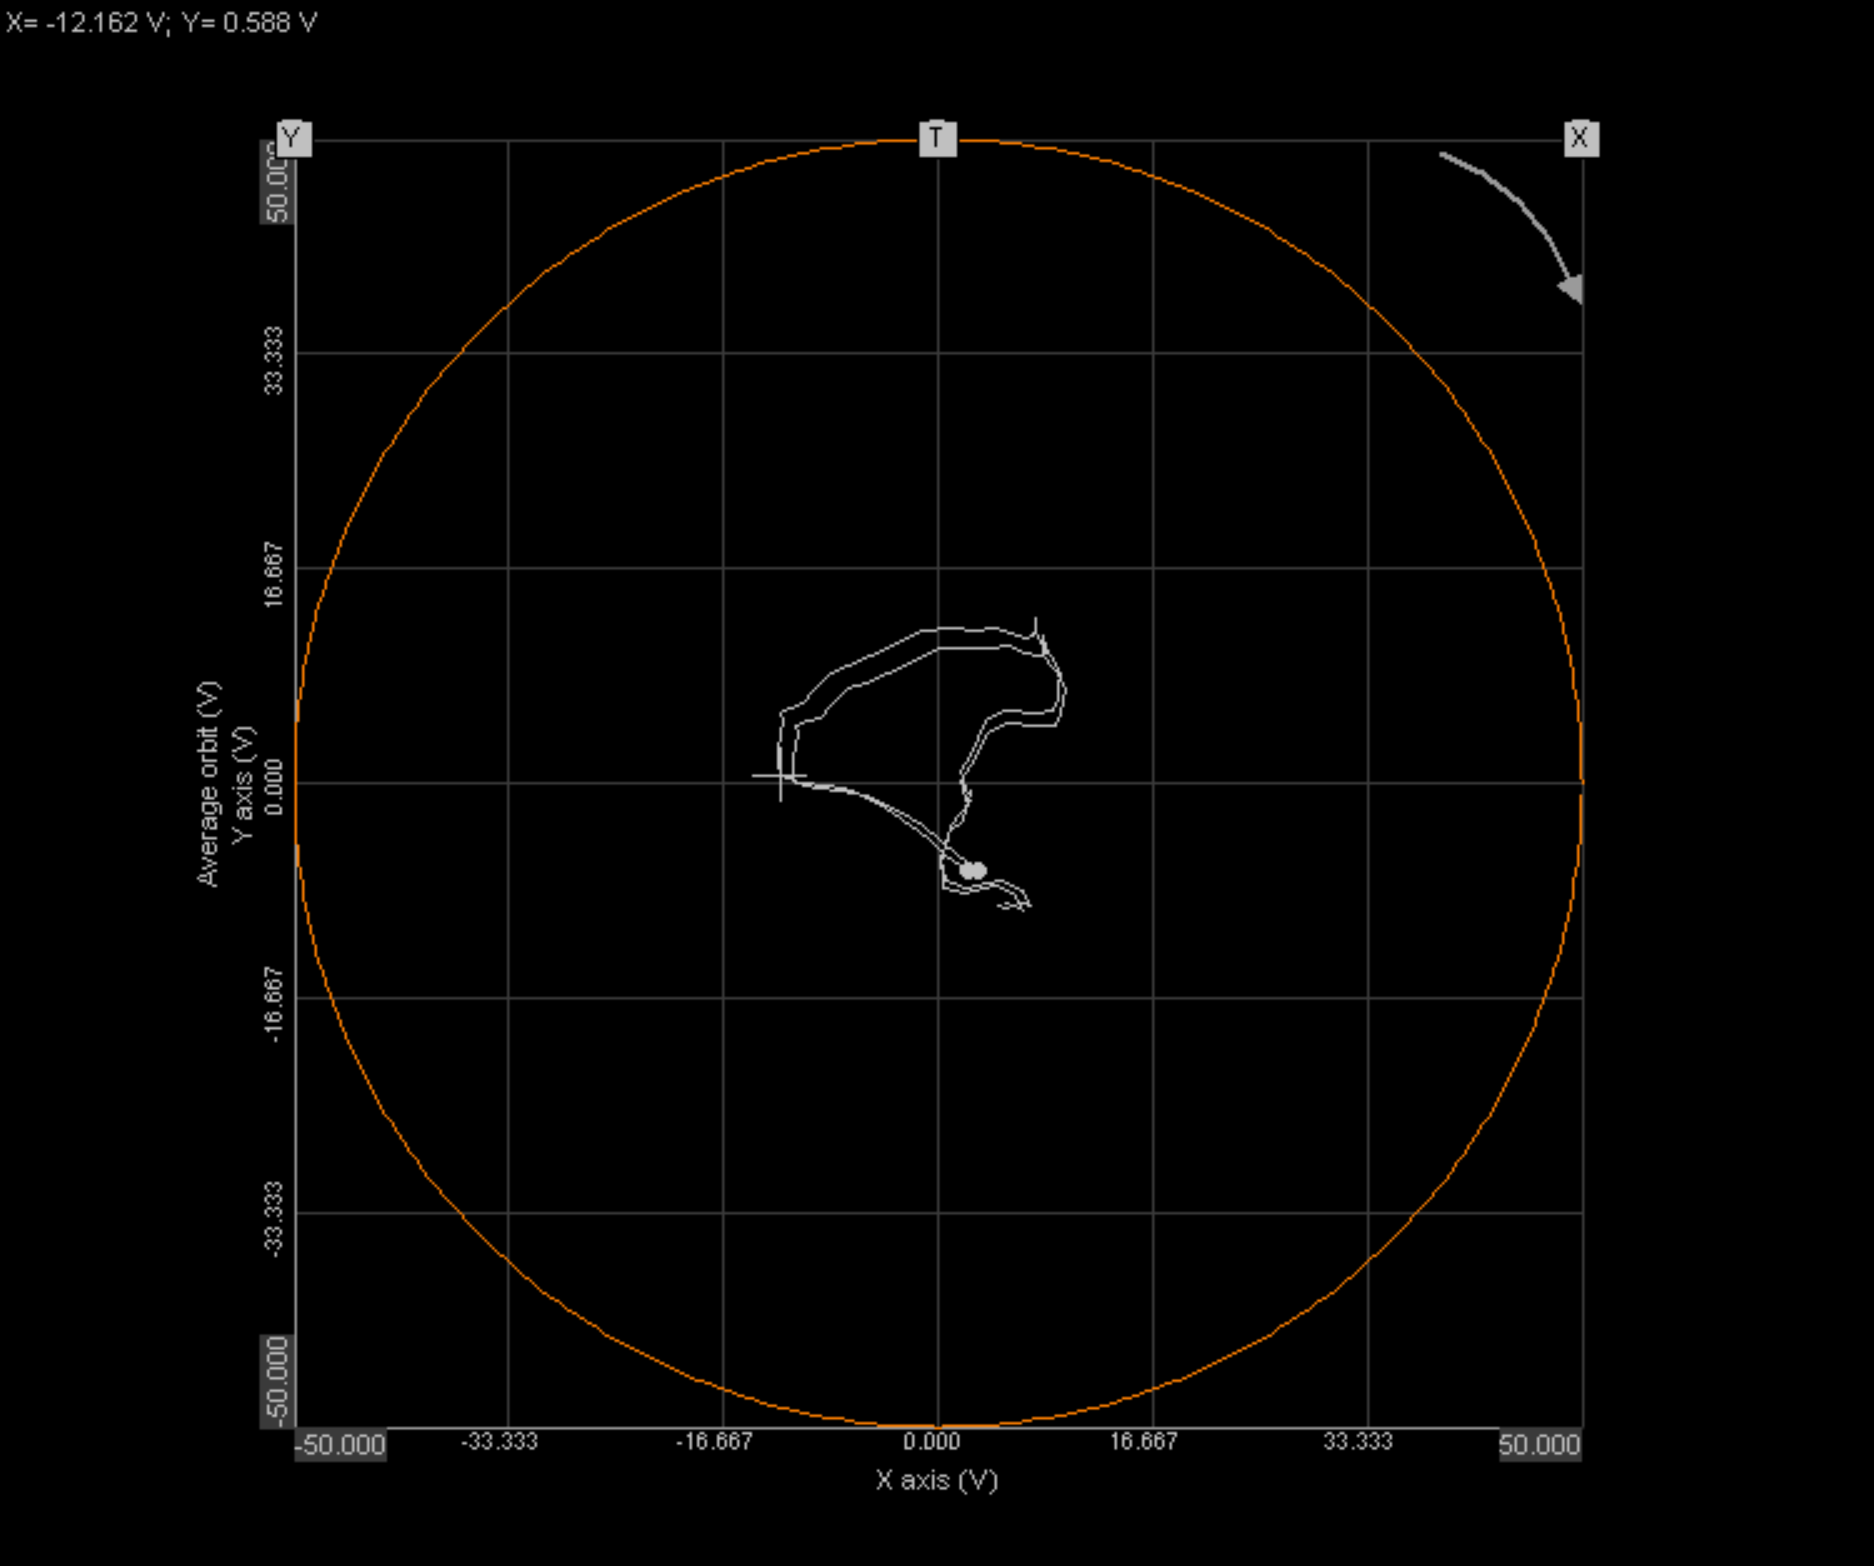
Average orbit with clearance circle
This representation is created by assigning Average Orbit channel to the Orbit Plot and switching on Clearance in the left side settings tab for Orbit Plot.
Average orbit is seen in white on the graph with clearance circle in orange.
X and Y mark the position of proximity probes, whereas T marks the tacho’s position.
Rotation direction is also shown on the graph with an arrow.
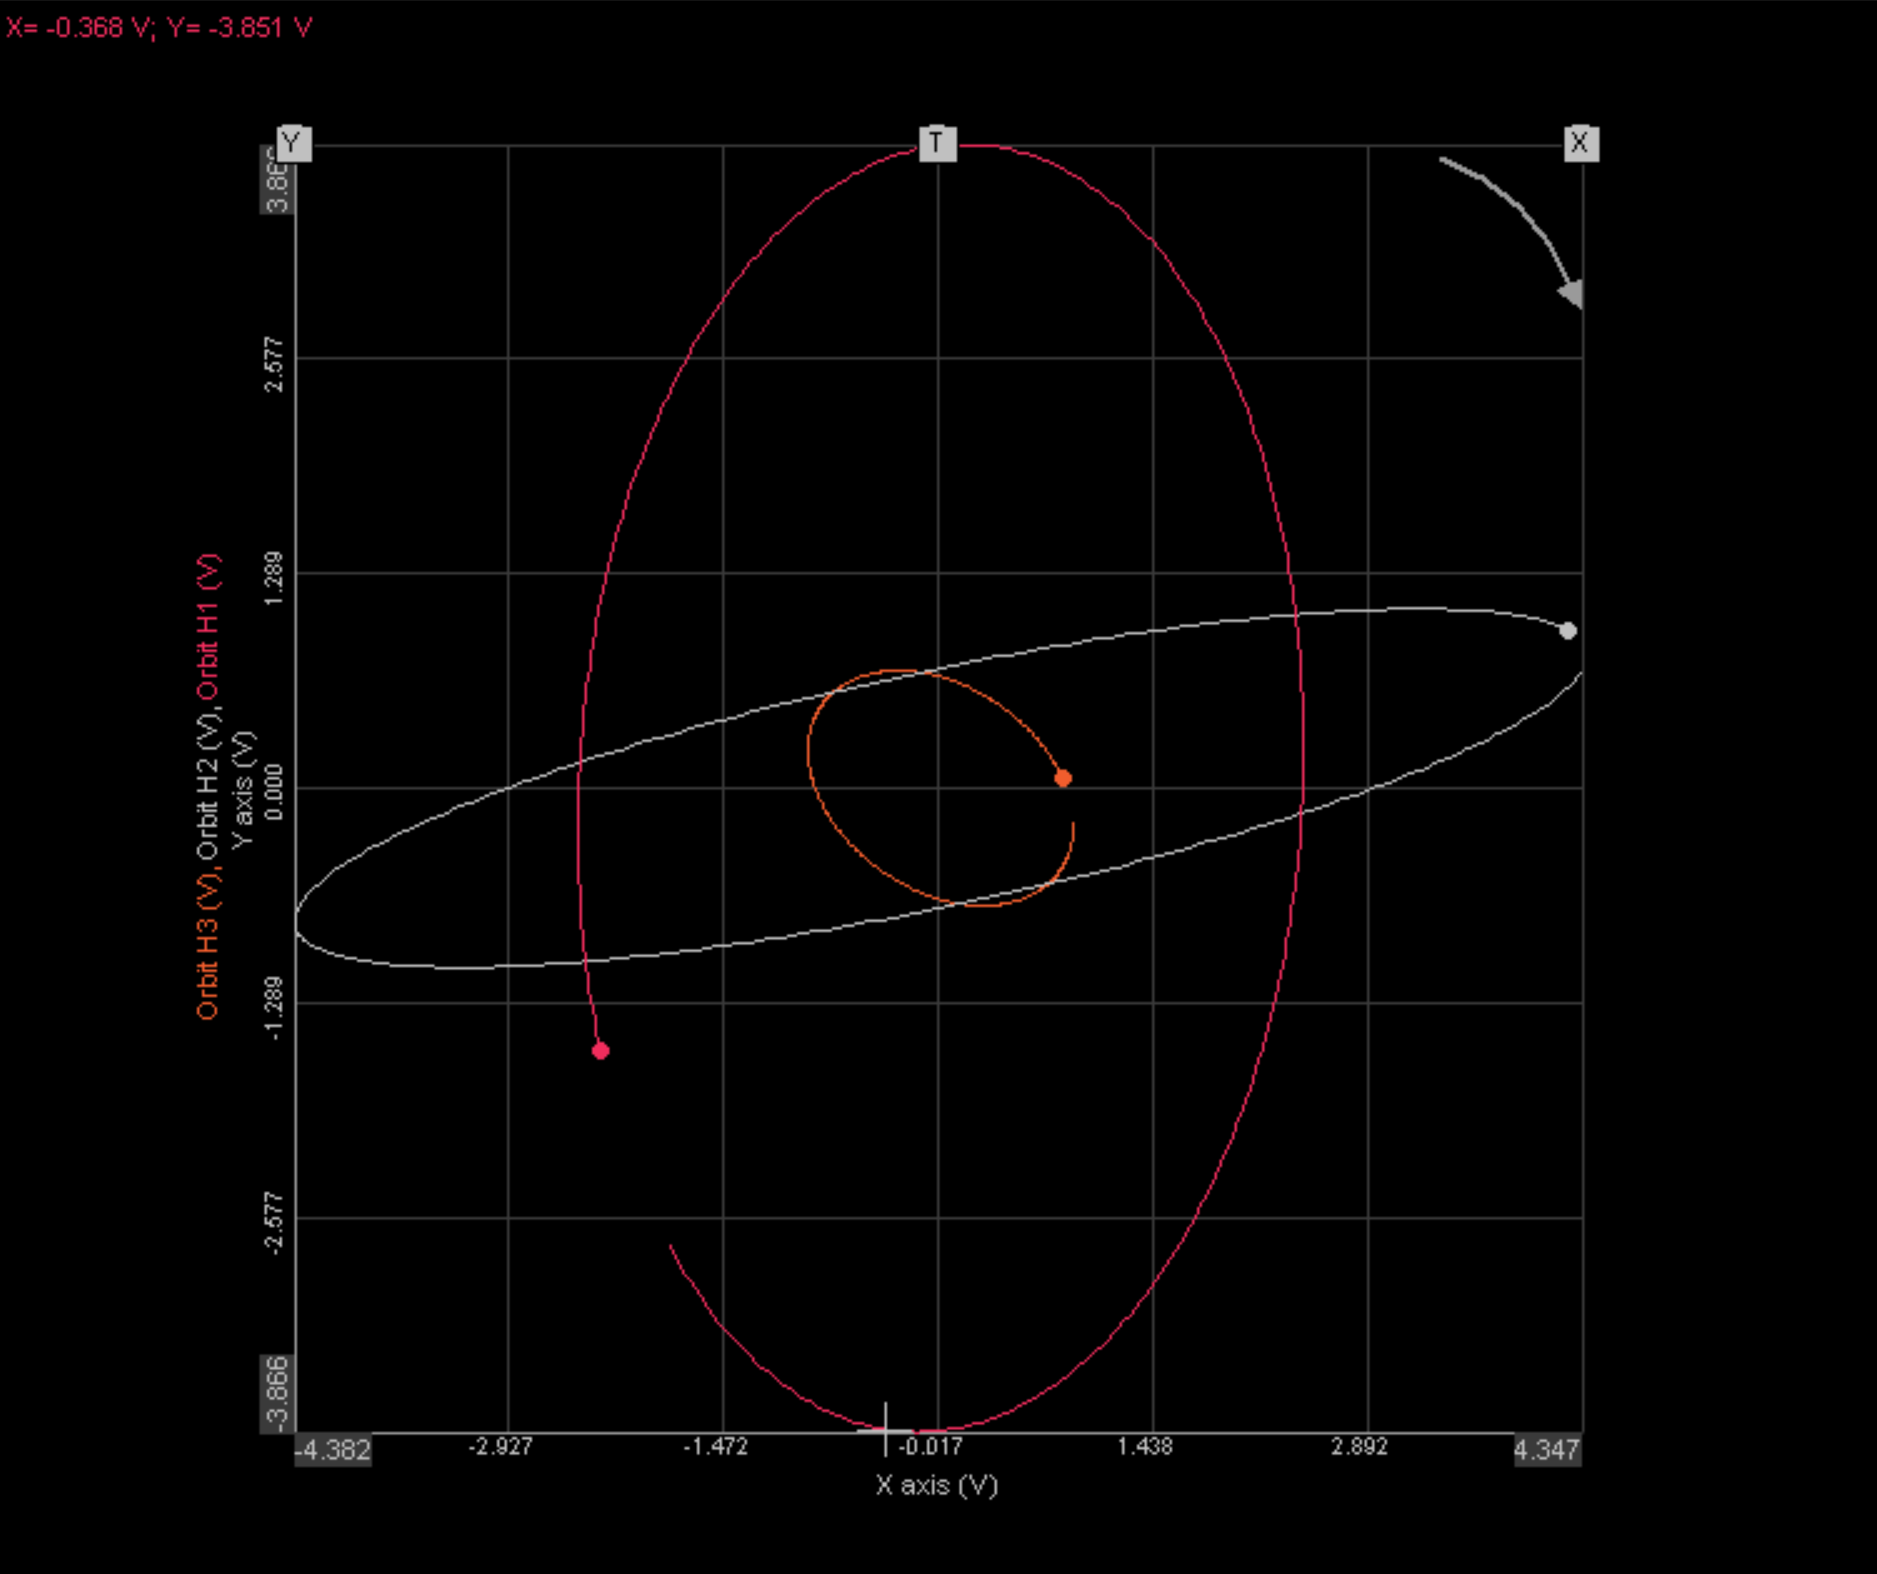
Nx/Filtered orbit
Depending on the list of harmonics to be extracted, there will be a harmonic orbit available for each order. They can be shown directly on Orbit Plot.
Above display widget shows example of filtered orbits in red, white and orange. The particular orbits shown are: 1X(Red), 2X(White) and 3X(Orange).
In addition, the software supports extraction of Subsynchronous/subharmonic orbit, that can be displayed in the same way as the harmonic ones.
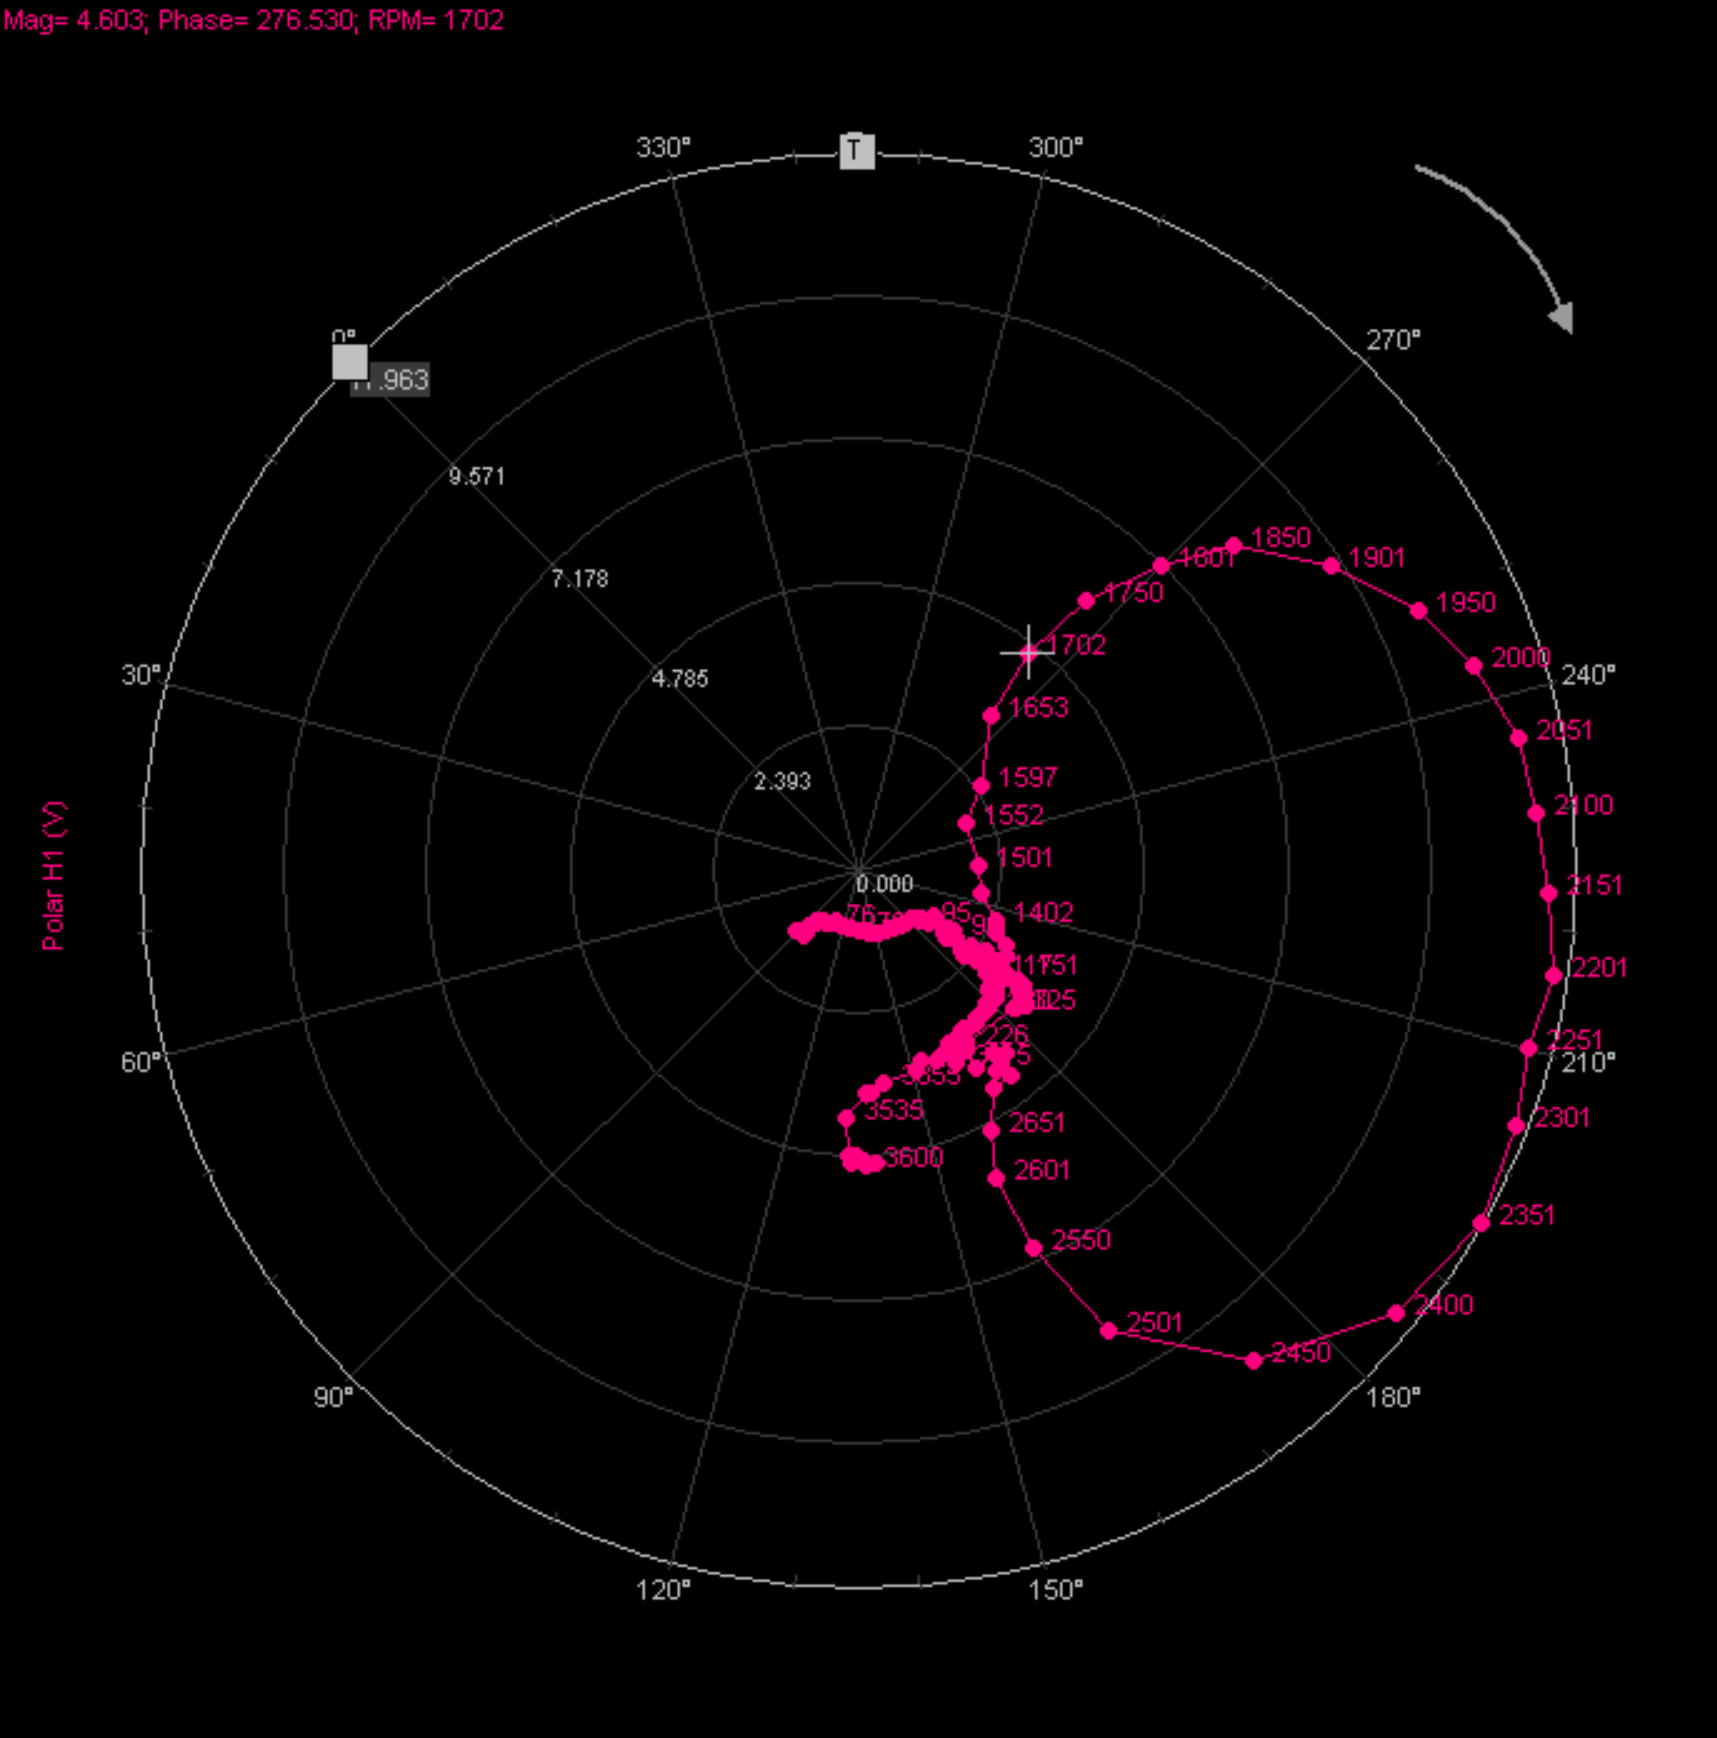
Polar plot
For each probe per bearing, a dedicated Polar channel is created by the Orbit Analysis module. To represent the data, a dedicated widget is available - Polar Plot.
A single display in polar plane displaying phase and amplitude(displacement) at certain RPMs.
If your test consists of different states of the machine e.g. runup, coastdown the polar plot will take into account the state of the user input control dropdown on top of the screen. Depending on the state selected there, data will be written in dedicated channel for runup and a different one for coastdown - this way it is easy to distinct the two and both sections can be shown on the same Polar Plot, using different color for each.
Bode plot
Display widget for complex channels with different available data to display: Phase, Magnitude, Real and Imaginary components.
Waterfall

.png)
Both order vs. RPM and FFT vs. time waterfalls are supported. Above image shows and example display of order waterfall vs. RPM with added digital display for speed.
Output list
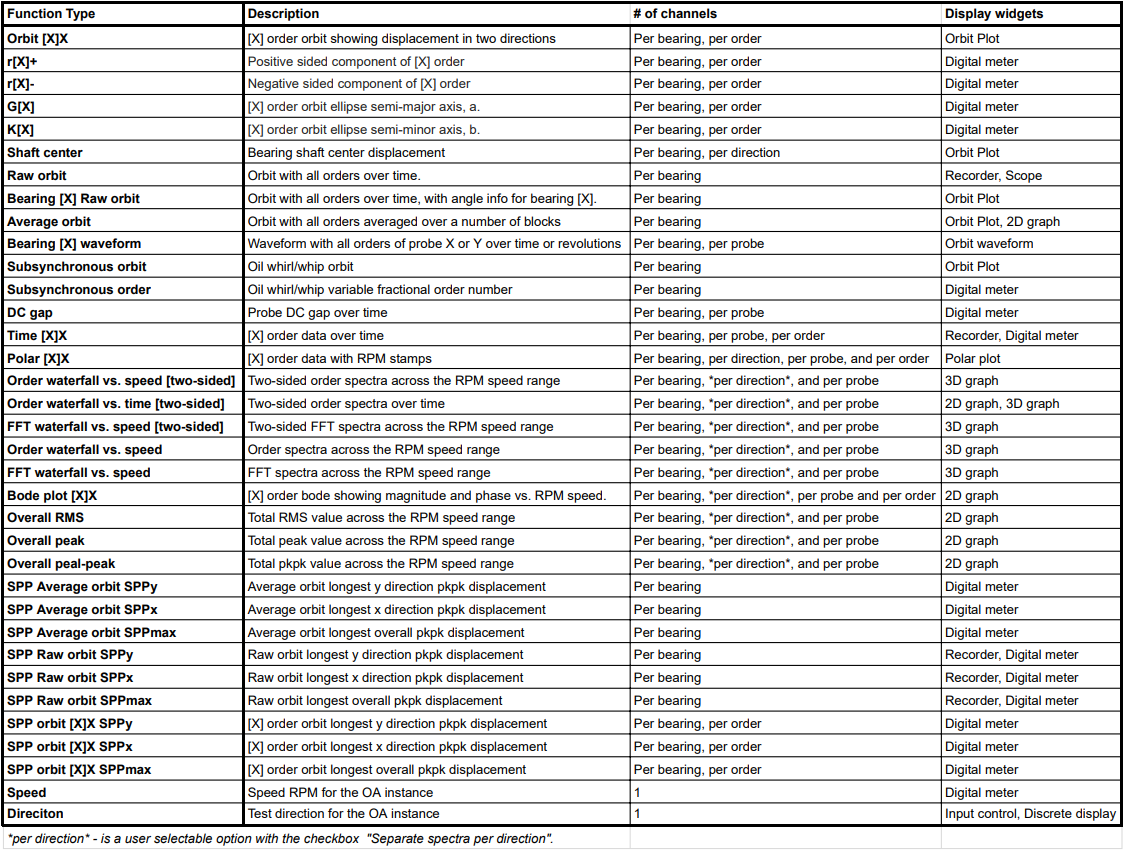
Below all possible output result variants are listed. Note that many of them will be created multiple times e.g. for each bearing and direction:
