FFT preview
The Dewesoft FFT (Fast Fourier transformation) instrument shows the frequency components of acquired signals in amplitude and frequency.

When you select FFT instrument in the design or run mode, following settings will appear on left part of the screen:
- Control properties - For detailed information about FFT instrument Control properties: grouping, number of column, Add / Remove, transparency,…see -> Control properties.
- FFT settings
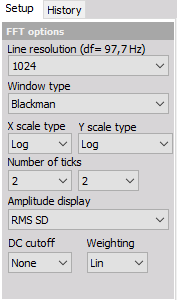
- Setup with Line resolution, Window type, X/Y scale type, Number of X/Y axis ticks, Amplitude display, DC cutoff and Weighting
- History - display options for Current FFT and Averaged FFT
Available appearance setting for FFT instrument in Run mode are:
- Changing the Frequency axis scale
- Y-axis scale/auto scale (Common instruments tools)
- Cursor Function (change the current position and scroll through the whole acquired data)
- Online calculation
- Channel selector
For detailed information about assigning / reassigning channels to/from FFT -> see -> Display settings.
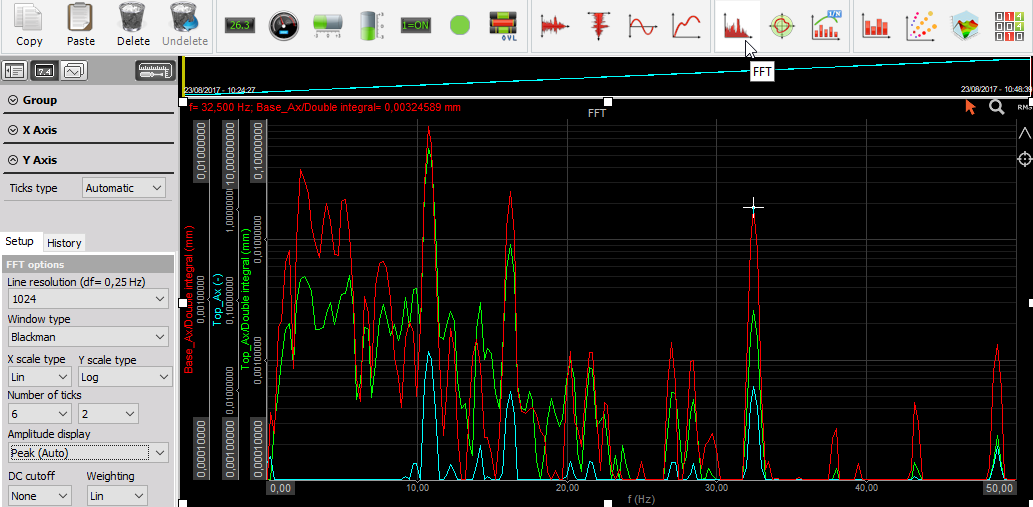
Appearance on screen
The FFT element offers all important information:
- channel name(s)
- unit(s)
- frequency information
- zoom functions…
For detailed information about instruments positioning, size and transparency see -> Screen edit functions.
Changing the Frequency axis scale
Run mode Frequency axis scaling
WARNING: Changing the frequency axis this way can’t be done in Design mode -> available only in Run mode.
Use the blue PLUS and MINUS symbols to expand or compress the Frequency axis. Clicking MINUS will show more Frequency across the graph until the maximum analyzable frequency has been reached.
Clicking PLUS will show the frequency more detailed.

Run mode Changing the Frequency axis scale
WARNING: Changing the frequency axis this way can’t be done in Design mode -> available only in Run mode.
Enter values
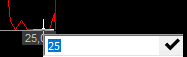
You may enter the values by yourself - simply click on the number at either extreme or minimum (see below) and then type in a new number.
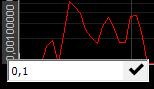
This is possible when the cursor has the following appearance:

When clicking on this cursor, enter the field for new value appear (see left). After entering the new min and/or max value press OK button and new Frequency axis scale appear on the graph.
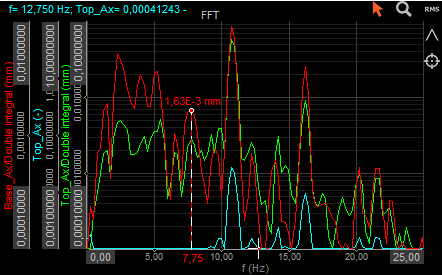
Cursor function
With two buttons in the FFT display, the function of the cursor can be defined.
With this function enabled (= default setting), the cursor shows the current frequency and amplitude values at the cursor position within the FFT signal. To show the current values in the cursor readout, just click on the desired position of the signal. To remove the readout, click again on this button - cursor marker.
![]()
With this zoom button enabled, you can zoom into any area - range of the FFT display. Just click into the display, hold the button (on this place vertical white line appears), move the mouse and release the button. To undo the zoom, just press the right mouse button in the graph.

Online calculation
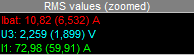
To keep an overview over the FFT, Dewesoft can calculate the RMS values and/or peak values (max) of the displayed signals. To activate the calculation, just click on:
 for the RMS values
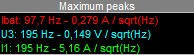
 for the peak values
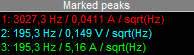
 for the marked peaks
FFT Settings
Serious FFT analysis requires several settings to get a useful result. All these settings Dewesoft combine in two tabs:
Setup
- Line resolution
- Window type
- X scale and Y scale type
- Number of ticks for X and Y axis
- Amplitude display
- DC cutoff
- Weighting
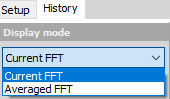
History
This setting defines Display mode for three group displays:
FFT Setup settings
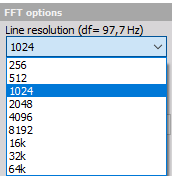
Line resolution
The FFT lines are responsible for the frequency resolution. The higher the FFT lines value, the better the resolution - but also the higher the calculation time.
This line resolution depends on the sampling rate and the number of lines chosen for the FFT. So if we want to have a fast response on the FFT, we choose less line, but we will have a lower frequency resolution. If we want to see exact frequency, we set higher line resolution. A simple rule is: if it takes 1 second to acquire the data from which the FFT is calculated, the resulting FFT will have 1 Hz line resolution. If we acquire data for 2 seconds, line resolution will be 0.5 Hz.
The current frequency resolution is mentioned in the selection line next to the heading (df = n Hz).
Example: The sampling rate has been set to 10000 Samples/sec and the resolution to 1024 FFT lines. These settings allow an FFT analysis up to 5000 Hz (half sampling rate). Now you divide the max analysis frequency by the FFT lines (5000 Hz / 1024 lines). The result is 4.88 Hz per line resolution (mentioned in the selection line).
To change the FFT lines, just click in the Line resolution field and select from the drop-down list.
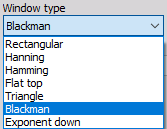
Window type
Dewesoft supports the most common Window types for FFT analysis. Select the window from the drop-down list according to your application.
X and Y scale type
Dewesoft allows:
- two different X (frequencies) axis types (Linear and Logarithmic)

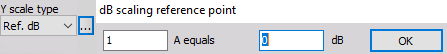
- four Y (amplitudes) axis scaling types (Linear, Logarithmic, 0 dB and Noise dB and Ref. dB scaled)

Select the axis type from the drop-down list according to your application.
When in Y scale type Ref. dB is selected, ‘Db scaling reference point’ window appears to enter this reference point and confirming that with OK.
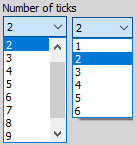
Number of ticks
You can select the Number of ticks from one to six ticks (dashed white line which divides the graph area) for your FFT display, which can differ between X and Y axis.
The first field in the row is to select the X axis ticks, the second row for the Y axis ticks.
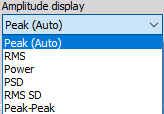
Amplitude display
The Amplitude display section defines display in Y-amplitude axis.
From Amplitude display drop down list we can select different types of amplitude scaling of the FFT. Basic setting is Amplitude (Auto), which shows for pure sine wave the amplitude of the sine.
If we have the sine wave with 2 V peak amplitude (4 V peak-peaks), we would have in the FFT 2 V amplitude. For the table let’s assume that the original signal unit is Volts. If the units are different, it will appear in the FFT.
| Amplitude type | Units | Description |
|---|---|---|
| Amplitude (Auto) | V | is the pure signal amplitude |
| RMS | Vrms | is the RMS amplitude, calculated as Amplitude/sqrt(2) |
| Power | V*V | calculated as RMS value squared |
| PSD | V*V/Hz | calculated as RMS squared, divided by the line resolution and sqrt(2) - used for checking the noise |
| RMS SD | V/sqrt(Hz) | calculated as RMS value, divided by the square root of line resolution - also used for checking the noise |
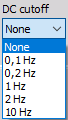
DC cutoff filter
TO remove DC or low-frequency components, select from drop down list the DC cutoff filter - lower limit.
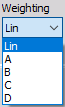
Weighting
As a standard, FFT analysis uses a Linear Weighting. For sound analysis, special FFT weighting can be set. As opposed to the sound module in math, where the weightings will be calculated in time domain, this will calculate the sound weighting in frequency domain.
FFT History settings
Current FFT
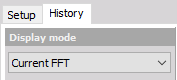
Display current FFT with settings in Setup tab (see above). Just select Current FFT from the Display mode drop-down list. Only this one setting is necessary for this Display mode type.
Averaged FFT
Use averaging mode to get a more stable FFT display. To activate the averaging just select Averaged FFT from Display mode drop-down list (see below).
All necessary setting can be done on Averaging options section.
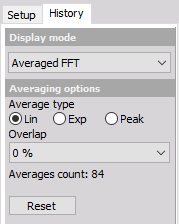
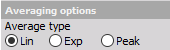
- Average type - From Averaging options select Average type: Linear, Exponential or Peak. As a standard, linear is selected.
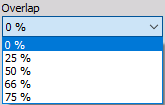
- Overlap - Depending on the application, it may be necessary to define a data overlap. When the window type is used, we have to use overlap otherwise some of the data will be ignored. Therefore the use of overlap is highly recommended.