Free marker
For more information about free marker, please visit Processing markers page.
Free markers can be added to any position on a 2D or 3D graph. Right click with the mouse on the wanted position and add a free marker or add a marker from Marker icons.
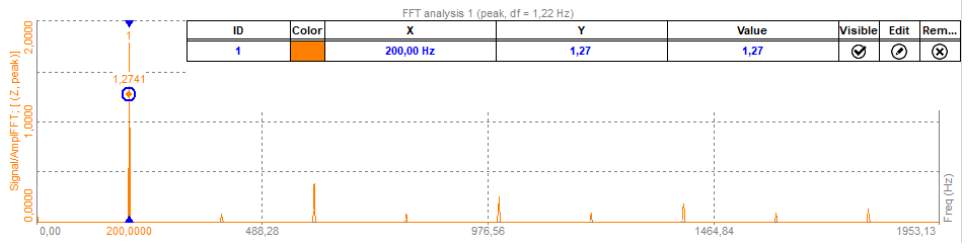
The Free marker shows us the X-axis value ( usually frequency) and Y-axis value (usually amplitude) at its position.
With ‘Show marker table’ selected you can see the table of markers - its ID, type, channel, color, its frequency (X-axis), and its amplitude (Y-axis). Here you can adjust the marker visibility, as well as edit their settings, or remove them.
Free markers offer additional options that can be accessed through the marker table Edit button, or by selecting the marker via left-click and then selecting the “Edit processing marker” item in the right-click popup menu.
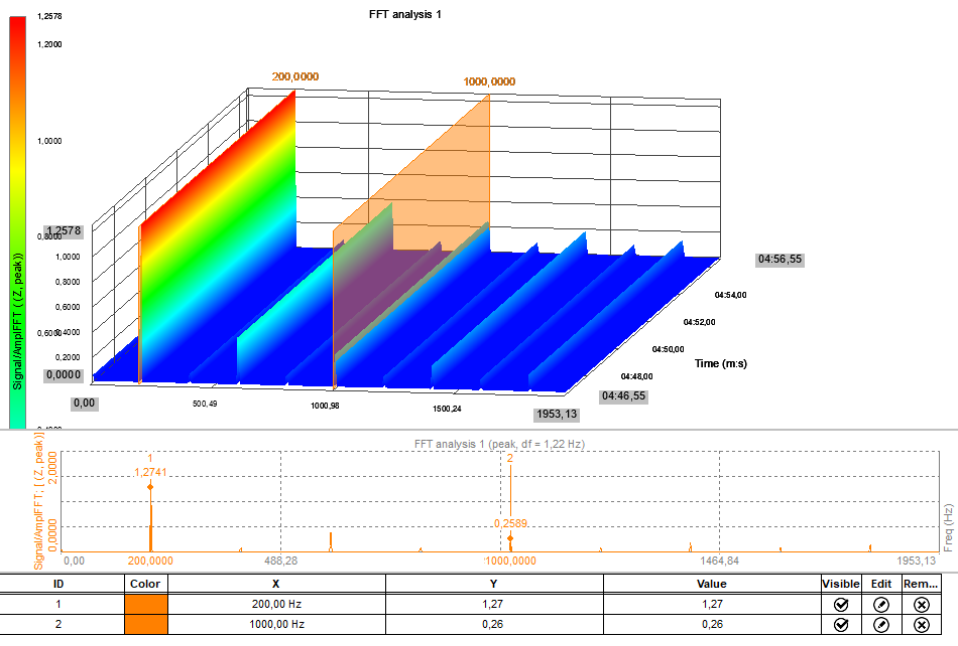
Free markers are also visible and adjustable on the 3D graph widget.