Sideband marker
For more information about sideband marker, please visit Processing markers page.
The sideband marker monitors the modulated frequencies to the left and right from the selected centerline.
Let’s generate an amplitude modulated signal with a carrier frequency of 1000 Hz and the baseband signal with a frequency of 100 Hz.
To add a sideband marker, right click on the peak and add the sideband marker.
- Current value - shows only a current value of the marker and can be interacted while storing
- Full history - stores calculated values in output channels and can be used as input in other modules
- Snap to data points - if this option is selected, the position of the marker will be snapped to the FFT bin, otherwise the marker can be placed at any frequency with the value being interpolated at that exact frequency
- Find peak in region - if this option is selected, the marker will automatically search for the peak in the selected frequency band centered on the position of the marker
- Improve peak accuracy - if this option is selected the peak position and value are interpolated from the FFT data
- Position source - the position source has two modes - Widget marker andChannel. If widget marker is selected, the position of the marker is defined manually. If Channel mode is selected, the position of the marker is defined by the current value of our chosen channel.
- Number of bands - the number of bands defines how many bands to left and right will be displayed
- Delta - delta defines the delta frequency between bands
Sideband markers have a center marker and several equally spaced sideband markers. By selecting any marker, you can drag the sideband markers to different positions while still maintaining the individual sideband space.
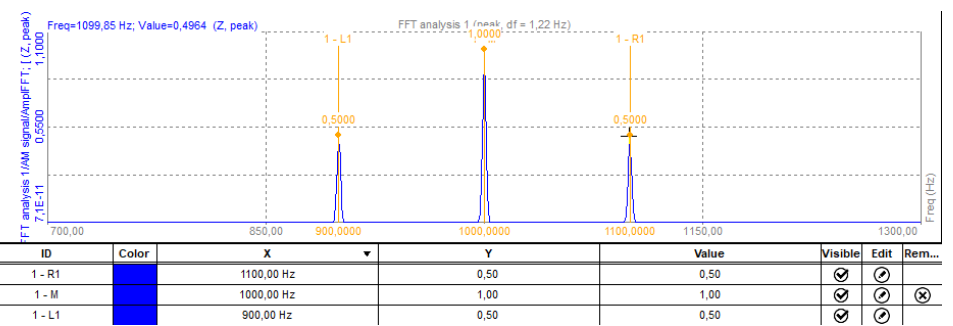
The sideband marker draws markers around the selected peak. We have to define the number of bands (for how many bands in each direction we want to see drawn lines) and Delta (distance between bands in Hz). For example, the selected position is 1000 Hz, a number of bands are 1, and Delta frequency is 100.
We can see that the central position is at 1000 Hz and we have one band in each direction. So the line on the left side is at 900 Hz and the line on the right side is at 1100 Hz. Distance between the lines can be defined by the user, in our example, it was 100 Hz.
Sideband markers can also be used on 3D graphs, where they can be dragged through the frequency spectrum.