Processing markers
Dewesoft software provides a range of processing markers that can be utilized to analyze time-domain, vector or matrix data. The markers are available for Recorder, 2D, 3D and new Campbell widget. These processing markers are a valuable tool for conducting in-depth analysis and gaining insights from complex data sets.
Available Markers
- Recorder Markers
- 2D/3D & Campbell plot Markers
Recorder Markers
Here is a list with additional information of all the possible markers that you can add to the Recorder widget, they can be used only in analysis mode. All the markers are listed on the right marker pannel, that apears directly on the widget.
- Free Marker
- Time Region Marker
- Trigger Marker
- Value Region Marker
- Damping Marker
- Reference Marker
- Point Marker
- Cleanup Marker
2D/3D & Campbell plot Markers
Here is a list with additional information of all the possible markers that you can add to a 2D, 3D or Campbell plot. All the markers are listed on the right marker pannel, that apears directly on the widget.
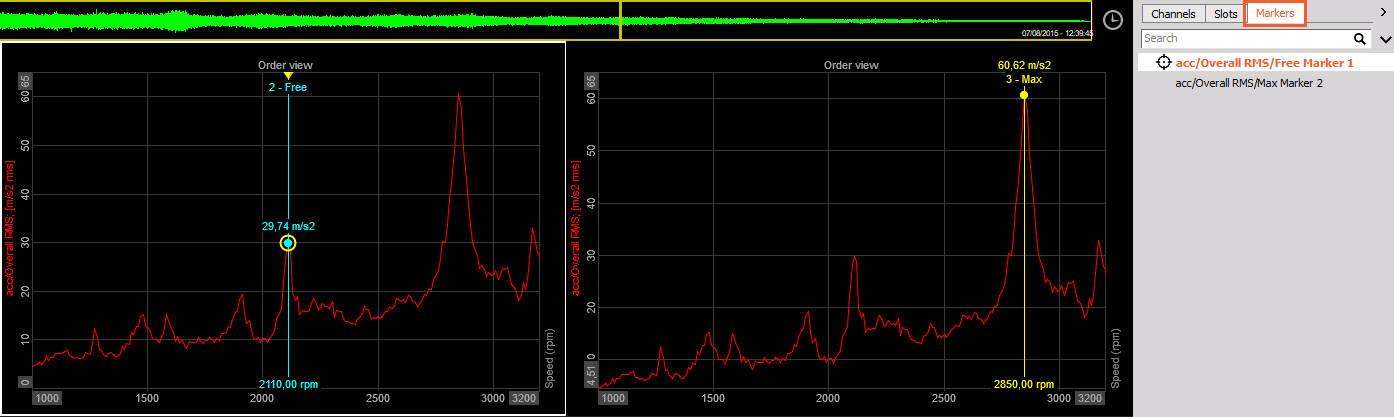
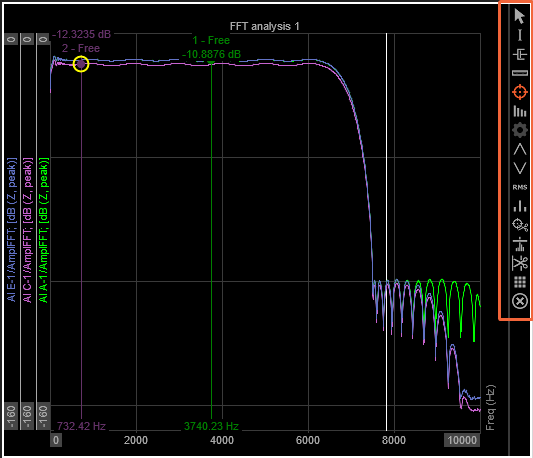
- Free marker
- RMS marker
- Max marker
- Max marker 3D
- Min marker
- Delta marker
- Trigger marker
- Vector cut marker
- Order Marker
- Harmonic marker
- Sideband marker
- Kinematic marker
- Damping marker
- X cut
- X Harominc cut
- Y cut
- Y Harmonic cut
NOTE: Not all markers are available for all types of data. Some markers can be used with an additioanl license.
NOTE: At the bottom you also have the “remove all markers” icon - that removes all the curently aplied markers to the widget.
Adding a Marker to Widget
Fom DewesoftX 2025.2 version you can add the marker from the marker pannel, that apears on the right side of the widget (Recorder, 2D, 3D or Campbell plot). The added marker will always be in Current value mode, allowing you to easily track and monitor specific data points.
NOTE: Want to remove all the markers from your widget? You can somly click the X icon in the Marker pannel.
If you are using DewesoftX 2025.2 and older - you can also add Markers
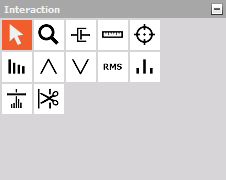
- Through Marker icons (only supported on 2D widget),
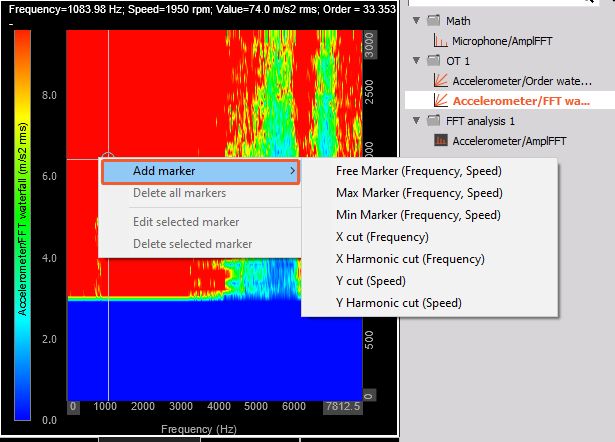
- With right-click on the widget and selecting Add Marker. In this way the Marker settings will pop-out and you can further customize the marker.
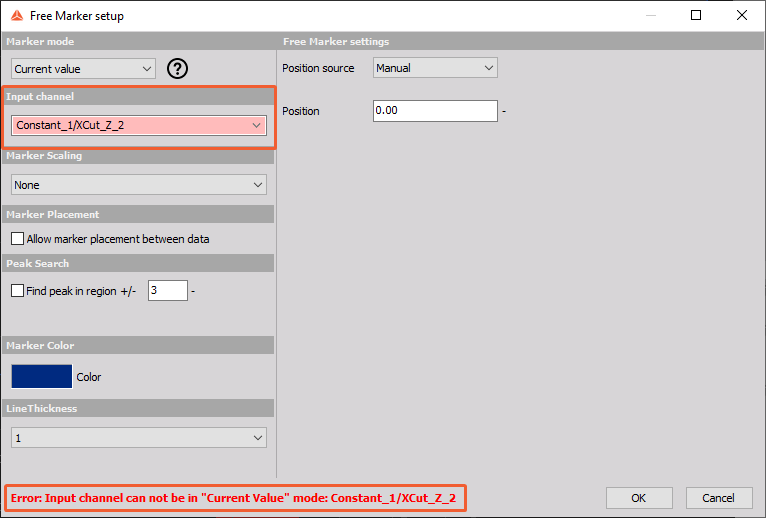
NOTE: You can not add a marker on a widget, where you are presenting another marker output that is set in Current value mode. If you try to add a marker you will get the following warning. You need to change the marker to “Full History” mode.
Adding a marker on a Zoomed-in area on 2D graph
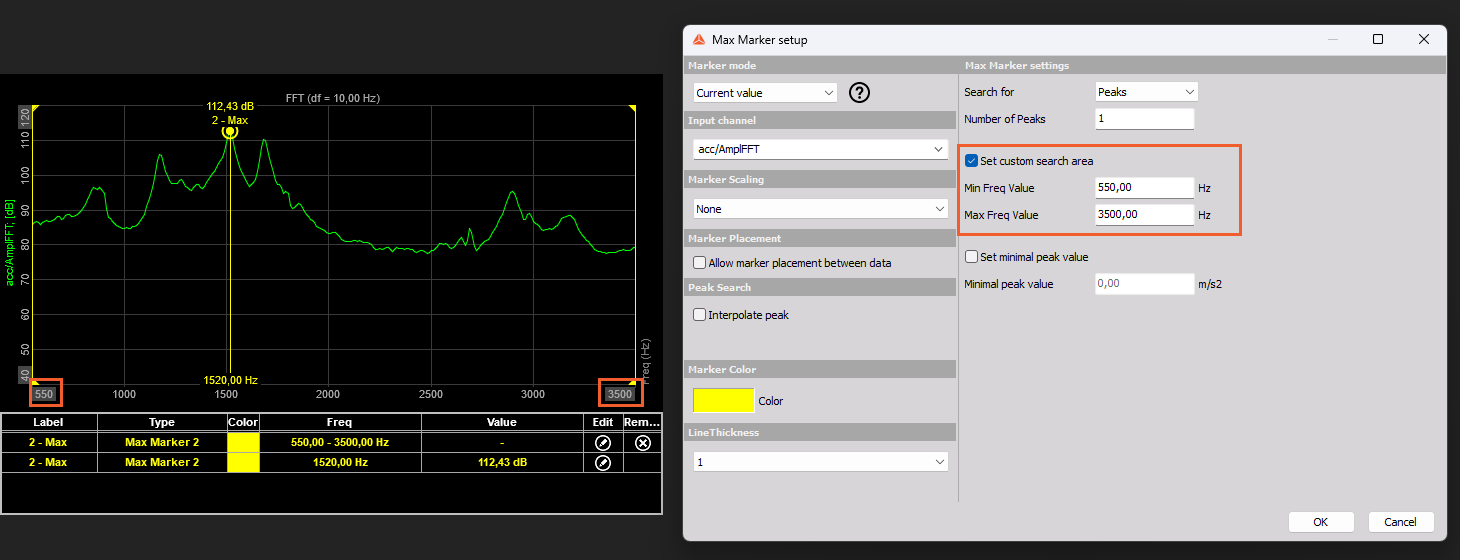
When you add a marker on alaready zoomed-in area on the 2D graph, the marker value will be calculated from this exact area. You will noticed that in the settings the custom search area will be automatically enabled. Once you unzoom the 2D graph area to its full size and you want to calcluate marker value to the full size, you need to adjust the marker settings and disable the custom search area.
Marker Settings
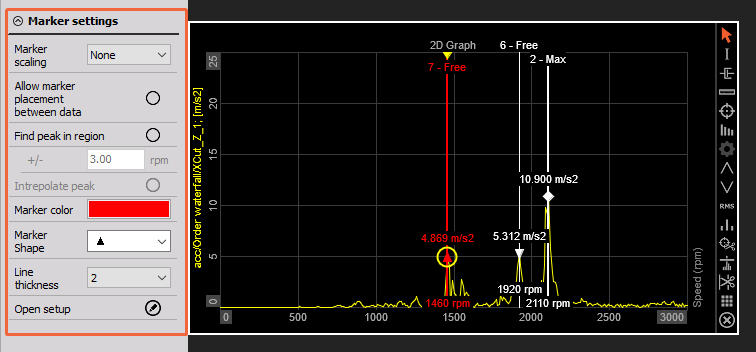
When you add marker to the widget, by right-clicking on the data, marker settings will be opened. There are a lot of generic settings that apply to all available markers. A quick preview of th Marker settings were added on the left side of the Display in an additional tab.
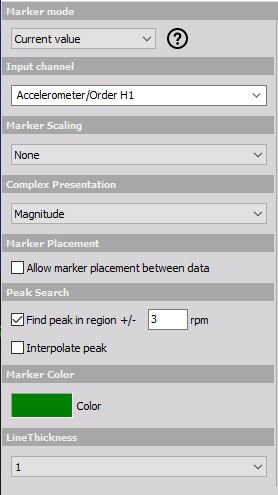
Marker Mode
The Marker mode can be seen in the marker table. * Current value - shows only the current marker value and can be interacted while storing, but can not be used as input for other modules * Full History - marker values are stored and an additional output channels are created that can be used as input in other modules
Input channel
The Input channel determines to which channel you want to pin the marker you are adding. This is mostly usefull when multiple channels are assigned to the same widget.
Marker scaling
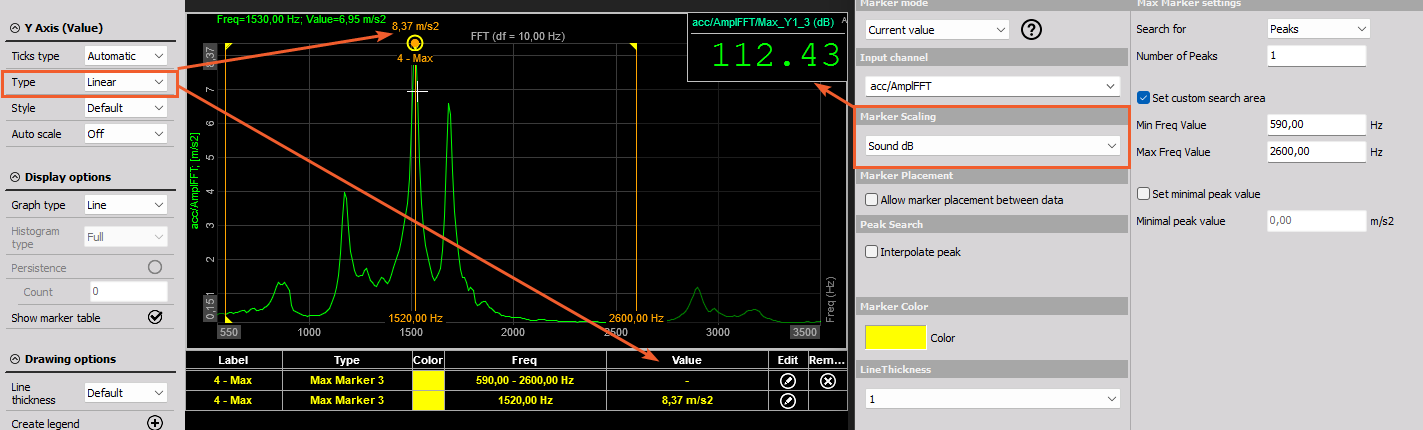
The marker value will be calculated accoring to selected scaling. When marker is placed on a widtet it’s label value and value in marker table will take into account the scaling selected on a widget. The channel value - the one you can place on digital meter or use for further calculation will always took into account the scaling option selected in the marker settings.
Complex presentation
Select which type of complex representation the data of the add marker will have. The marker will only appear on the widget, when the complex presentation of data and marker are the same.
Marker Placement
Allow marker placement between data - when enabled the marker will always align with the actual data point. When disabled the marker can be placed between two data points.
Peak search
- Find peak in region +/- - Limit the range of the peak. This mean that two peaks can not be found in the limited range.
- Interpolate peak - When peak interpolation is enabled, peaks might be determined between the graph spectral lines.
Interpolate peak uses 3 neighbor lines on both sides of the peak line (7 lines in total) to estimate the interpolated peak value and axis location.
The interpolated amplitude value is calculated from the energy sum of the used 7 lines. If the energy sum is too high compared to the original peak line energy, then it is concluded that multiple peaks components are present in the used 7 lines - In such cases no interpolated peak value can be determined and the calculated value will just output the peak line value. This will also happen if the peak line value is buried in the noise floor.
The interpolated peak axis location is determined based on an energy weighted calculation of the used 7 lines.
Marker color
Select the desired marker colour.
Line Thickness
Select the thickness of the marker line that is presented on the widget.
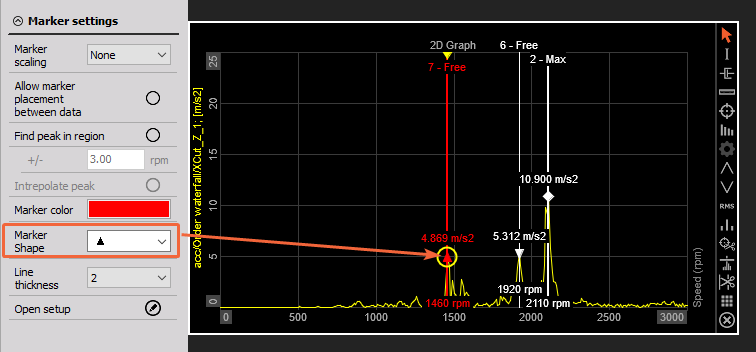
Marker Shape
You can select the shape of the marker on the recorder. The shape is added on the point of the marker and can’t be applied to all the available markers. The shape can also be seen in the Marker Table under a new “Shape” column.
Marker Module
In setup under math modules you can add Marker module, where you have an overview off all added markers in setup. You can also access the setup of the markers.
All the classic edit columns are available for marker, where you can set the marker to online/offline, stored/not stored, …
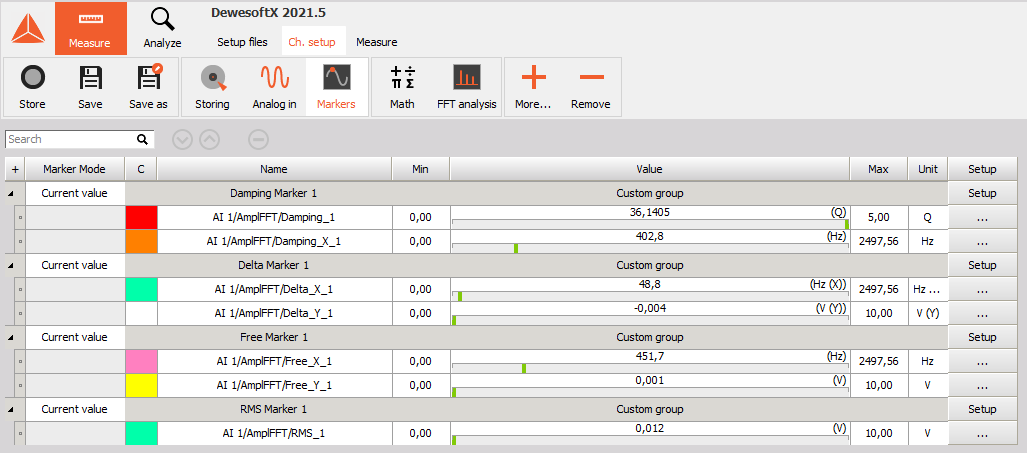
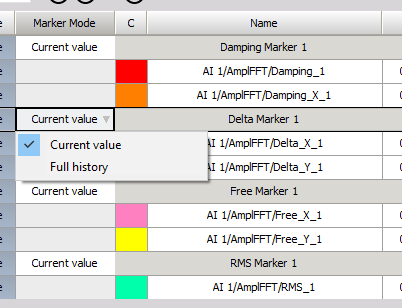
Marker mode (Current value or Full history can be assesed easily and changed for one marker at the time or all selected markers at the same time
Marker visibility
By default, markers in Dewesoft software are linked to the channel on which they are added. This means that they will be displayed on every graph where that channel is presented. However, Dewesoft software also allows you to unassign markers from specific widgets (2D or 3D) so that you can fully customize how you want to display them.
By displaying different marker parameters on different widgets, you can make your reports clearer and more effective. For example, you can display markers related to one specific parameter on one widget and display markers related to another parameter on a different widget. This allows you to focus on the specific data you need for each analysis and makes it easier to identify trends or anomalies.