Max marker 3D
NOTE: Shared marker parameter information is described under the Processing markers page.
A Max marker is a perfect tool to find either a maxima or peak in your data.
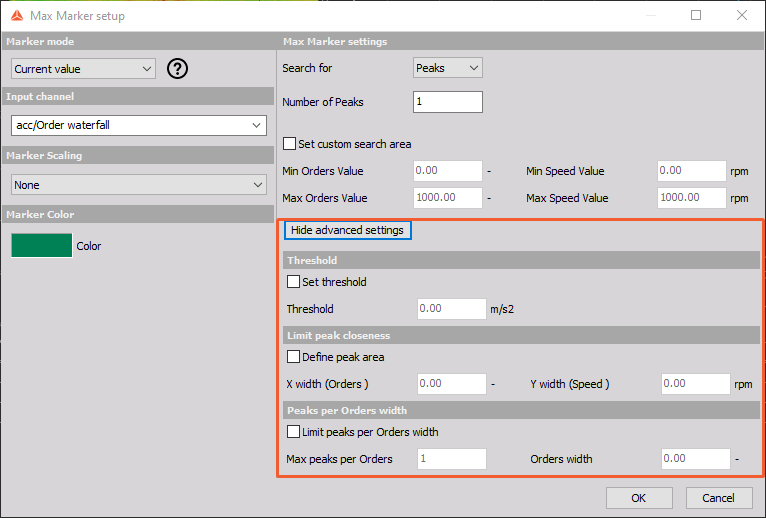
Once you are inside the max marker settings will appear, where you can select if you want to search for Peaks or Maxima and how many of those values you want to find.
Peaks - finds the peaks in the data. The peak function will check the amplitude of all 8 neighbouring points around the center point value of a 3x3 matrix. Two conditions have to be fulfilled:
1. The amplitude of at least one neighbouring point has to be lower than the center point.
2. All 8 neighbouring points must not have an amplitude value higher than the middle (peak) point.
Maxima - find maximum values in the data, that can be located at the same peak
You can also adjust the Custom search area - which basically means that you limit the data of the calculation.
Additional settings
You can now define the Threshold for the found peak area. If any of find peaks, which were defined by a user has a lower value than a threshold it will not be shown in a marker table or on a data.
There are some additional settings that allows you to define how many peaks/maxima you would like to have and to specify where they should appear in relation to other peaks.
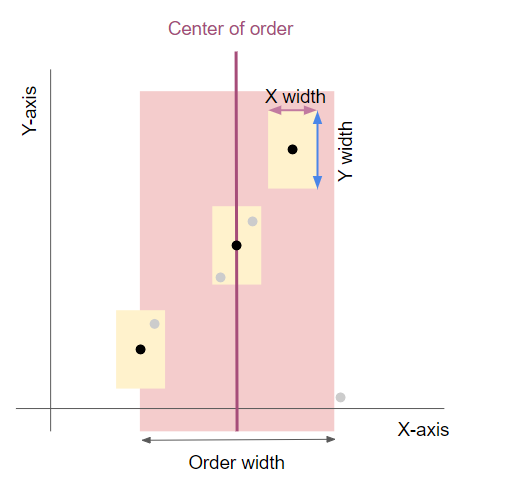
You can limit/define the Peak closliness, which is actually peak width area. You can define the X-axis width and the Y-axis widt. In the following example picture we can see multiple dots inside the yellow frame, which represents peak values. But as the yellow frame represents the highest peak width area other gray dots are not taken into acoutn as a valid peak.
Next you can Limit peaks per Order widtg by defining maximum number of peaks you want to present per order. Additionally you need to define the width of the order area. Once the defined peaks/maxima are found in the order, we will try to find the next peak/max value in the data, that needs to be in the defined range.