Harmonic marker
For more information about harmonic marker, please visit Processing markers page.
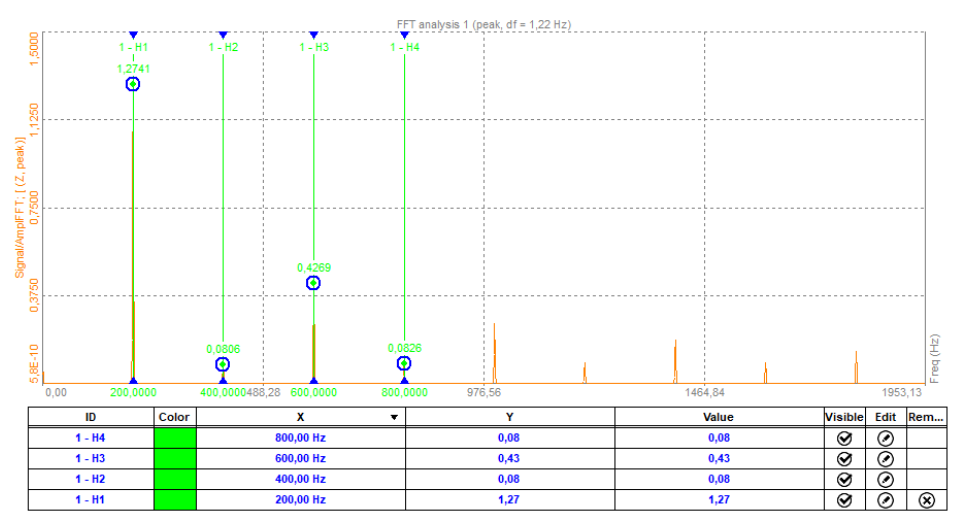
The harmonic marker is of great help when identifying the harmonics of the fundamental frequency in a spectrum.
To add a harmonic marker, right click on the 2D graph and add a harmonic marker.
- Current value - shows only the current value of the marker and can be interacted while storing
- Full history - stores calculated values in output channels and can be used as input in other modules
- Snap to data points - if this option is selected, the position of the marker will be snapped to the FFT bin, otherwise the marker can be placed at any frequency with the value being interpolated at that exact frequency
- Find peak in region - if this option is selected, the marker will automatically search for the peak in the selected frequency band centered on the position of the marker
- Improve peak accuracy - if this option is selected the peak position and value are interpolated from the FFT data
- Harmonic position source - the position source has two modes - Widget marker andChannel. If a widget marker is selected, the position of the marker is defined manually. If Channel mode is selected, the position of the marker is defined by the current value of our chosen channel.
The harmonic marker can be enabled at any frequency.
The harmonic marker will mark the harmonics of the selected fundamental frequency. All bands of harmonic marker can be selected and moved to any other frequency with the harmonics updated live.
Monitoring harmonics is very important in the order tracking analysis.
You can also pick and drag the fundamental frequency through the FFT spectrum. Harmonics will automatically follow.
Harmonic markers can also be displayed on 3D graph, where you can pick and drag the fundamental frequency through the spectrum.