Marker table
Marker table widget is designed for presenting different parameters/values of Processing markers at one location.
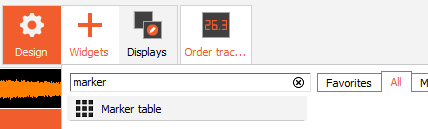
The Marker table widget can be added in Design mode as a standard widget. When you add the marker table in this way all currently present markers will be shown in the table.
You can also add the marker table by enablinf the Show marker table option in 2D or 3D graph options, displayed on the left side of DewesoftX screen. When you add the marker table in this way, only markers linked to the channels presented on that exact graph will be shown.
Marker table settings
The Marker table offers a magnitude of settings that allow you to navigate through markers easier.
There are two Visual control options:
- All channels - all markers will be listed in the marker table
- Selected channels - only markers linked to the selected channels will be listed in the marker table
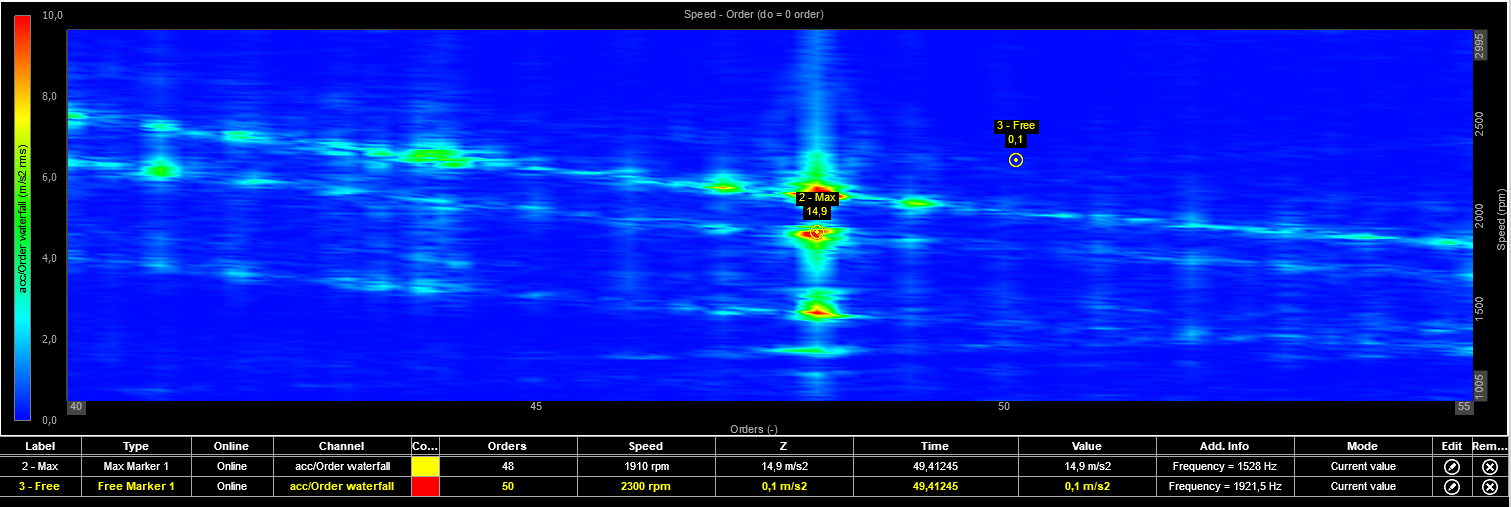
You can present different parameters inside the marker table. To configure the columns, press the circled pen button next to the Edit columns setting. All available columns are listed here:
- Label - The label of the marker, which is also displayed on the widget. The Label is editable.
- Type - Defined type of the marker ( Max, Free, etc)
- Online Status - online or offline mode. When marker is offline additional recalculation is needed.
- Channel - channel linked to the marker
- Color - maker color
- X - the X value of the marker. If there is only one type of data the X will be renamed as the X axis
- Y - the Y value of the marker. If there is only one type of data the Y will be renamed as the Y axis
- Z - the Z value of the marker
- Time - current time related to the yellow cursor postition
- Value - output value of the marker.
- Add info - additional information of marker. This is only shown when marker is placed on the Order tracking data
- Mode. - Current value or Full History mode
- Edit - when the edit button is pressed you are redirected to the marker settings
- Remove - remove a marker
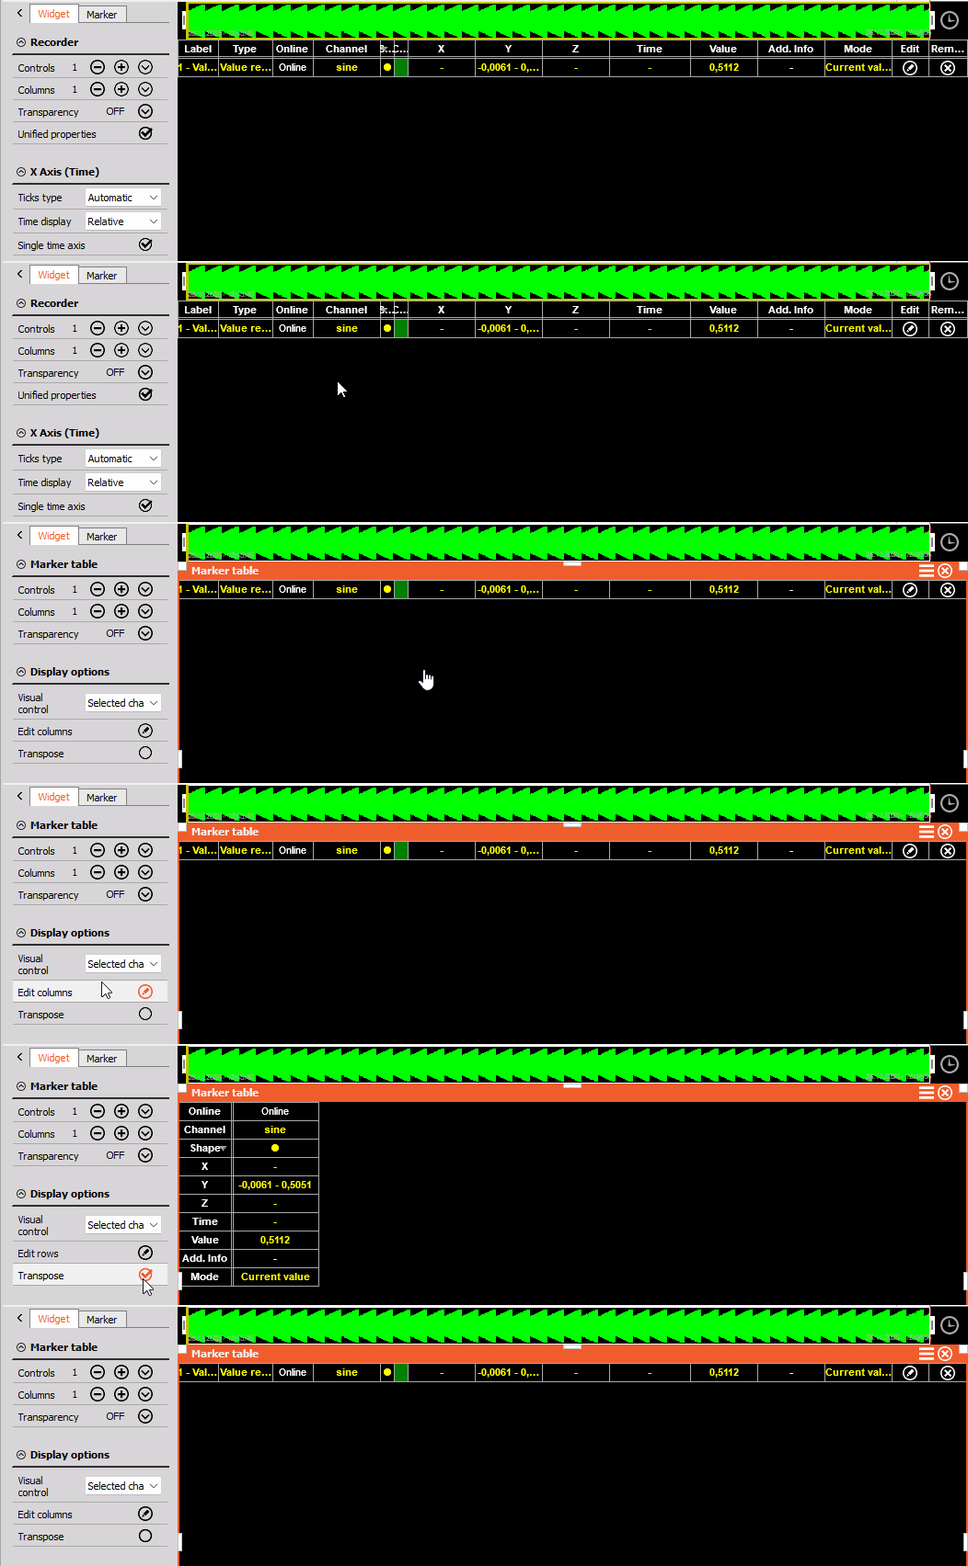
Finally, you can use the Transpose function to swap the data displayed in rows and columns.
You can read more about markers (how to add them, …) on following pages Processing markers 3D graph.