FFT Preview 
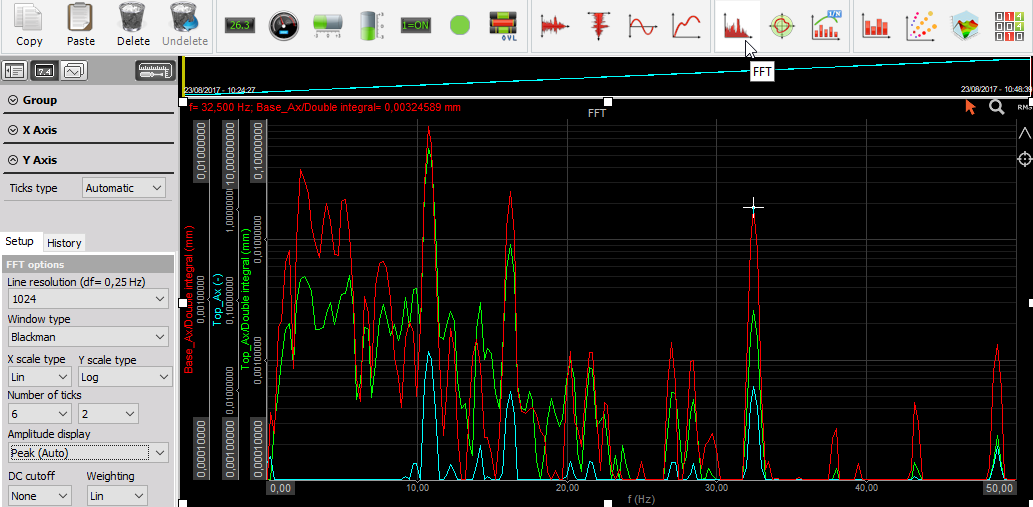
The Dewesoft FFT (Fast Fourier Transformation) preview widget shows the result of a discrete Fourier transform - a conversion of a signal from its original domain to a representation in the frequency domain (and vice versa). The results are presented as a graph with the frequency on the x-axis and the signal(s) values on the y-axis.
TIP:For more information on FFT analysis, please see the following Guide to FFT Analysis.
When you select the FFT widget, the following settings will appear on the left side of the screen:
- FFT preview Control properties - applicable to all widgets, please consult the linked section of the manual.
- X Axis (f)
- Y Axis (Value)
- Drawing options
- Setup
- History
The Channel selector will be to the right of the screen.
You can find the Additional options (e.g. run mode scaling, cursors) at the end of this page.
X and Y Axis
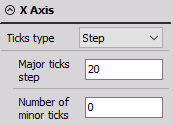
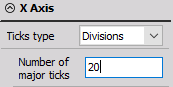
You can change the ticks type of the X and Y axis independently. Ticks are white lines that divide the graph area into sections. You can either choose how big a step between two major ticks will be (and the number of minor ticks between) or how many major ticks will appear on the graph, i.e. the number of divisions. By default, the ticks type is set to Automatic, meaning that Dewesoft will choose the appropriate scale.
You can also choose the Style of the Y axis:
- Default - each channel gets its own axis and scale
- Hidden - keeps the data appearance of the Default option, but hides the axes
- Single - all channels are on one single axis with one universal scale
- Compact - similar to Default, but with less space between the axes
Drawing Options
In this section, you can further customize the appearance of the graph. You can set Line thickness, Show channel limit status and/or Show bandwidth line on the graph.
Setup
The setup section is divided into two subsections:
FFT Options
The available options are:
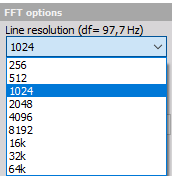
Line Resolution
The FFT line resolution dictates the frequency resolution. The line resolution depends on the sampling rate and the number of lines chosen. The higher the FFT lines’ value, the better the resolution. However, a better frequency resolution means that the calculation time will be higher.
Therefore, if you want a short FFT response, you can choose less lines, but you will have a lower frequency resolution. If you want to see the exact frequency, choose a higher line resolution which will make the response time longer.
Example: The sampling rate has been set to 10000 Samples/sec and the resolution to 1024 FFT lines. These settings allow an FFT analysis up to 5000 Hz (half of the sampling rate). If you divide the max. analysis frequency by the number of FFT lines (5000 Hz / 1024 lines), you will get 4.88 Hz, which is the line resolution.
You can see the current line resolution above the dropdown menu (df = _ Hz).
The Sync DB buffer is the memory size for all synchronous channels. If its length is not big enough, you will get the following error message if the line resolution is too big:
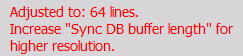
For information on increasing the buffer, please visit Options - Settings - Performance.
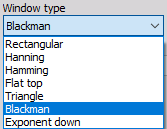
Window Type
Dewesoft supports the most common Window types for FFT analysis. You can select the window from the dropdown list according to your application.
Amplitude Display
You can select how the y-axis amplitude is displayed from this dropdown menu. The default setting is Peak.
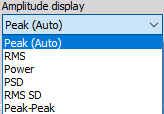
You can see all available amplitude displays in the table below:
| Amplitude type | Units | Description |
|---|---|---|
| Peak (Auto) | $V$ | pure signal amplitude |
| RMS | $V~rms$ | RMS amplitude, calculated as $Peak/ \sqrt2$ |
| Power | $V^2$ | calculated as RMS value squared |
| PSD | $V^2/Hz$ | calculated as RMS value squared, divided by line resolution and $\sqrt2$ - used for checking noise |
| RMS SD | $\sqrt(Hz)$ | calculated as RMS value, divided by the square root of line resolution - also used for checking noise |
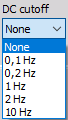
DC Cutoff Filter
To remove DC or low-frequency components, you can choose the limit for the cutoff filter.
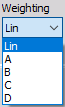
Weighting
Normally, FFT analysis uses linear weighting. For sound analysis, special FFT weighting can be set. For more information on Acoustic weighting filters, please refer to the linked page of the manual.
Setup Drawing Options
In this section, you can set up scale types for both axes via dropdown menus according to your application.
X Scale Type
Two scale types are available:
- Linear
- Logarithmic - default
Y Scale Type

Five scale types are available:
- Linear
- Logarithmic - default
- 0 dB - for RMS amplitudes
- Sound dB - for RMS amplitudes
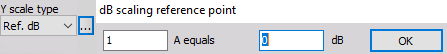
- Ref. dB - a button for the dB scaling reference point menu will appear, click on it to customize the scale
History
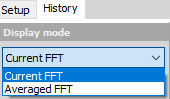
Two display modes are available:
- Current FFT - default
- Averaged FFT
Current FFT
This mode will display the current FFT. There are no additional options.
Averaged FFT
Averaged FFT display mode will result in a more stable FFT display. After selecting this mode, an Averaging options section will appear below.
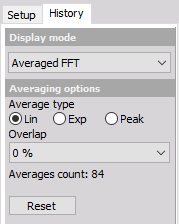
- Average type
- Linear - default
- Exponential
- Peak
- Overlap - Depending on the application, it may be necessary to define a data overlap, so that no data gets ignored (default is no overlap).
- Averages count - number of sweeps used for the average
- Reset - clears the accumulated buffer, allowing a fresh calculation
Additional Options
Run Mode Frequency Axis Scaling
Click once on the axis to autoscale it. If there is a specific frequency range of interest, you can change the scaling by doing one of the following:
Buttons
When in Run mode, use the grey + and - buttons to shrink (zoom in) or expand (zoom out) the Frequency axis, respectively. You can expand it until the maximum analyzable frequency has been reached. The buttons are in the bottom left corner of the widget

Enter Values
You can also enter the min./max. frequency axis values by yourself - click on the number at either extreme and then type in a new number. This is possible when the cursor has the following appearance:

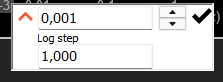
You can use the arrow on the left to show the Step field as well.
Select and Zoom
After clicking the magnifying glass symbol in the upper right corner of the graph, you can zoom into any area of the graph. Move your mouse to the graph, click and drag to select an area of interest. When you release the right mouse button, the graph will be zoomed in.

To undo zoom, right click on the graph.
Cursors
This function is enabled if the cursor symbol in the upper right corner of the widget is orange. If it is not, click on it once.
![]()
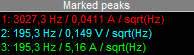
When moving your mouse over the signal, you will see the values of that sample point in the upper left side of the widget. If you want to mark a specific point (marked peak), click once. Right click to unselect all marked peaks.
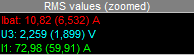
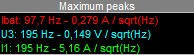
Online Calculation
Dewesoft can calculate the RMS values and/or peak values (max.) of the displayed signals. To activate the calculation, click (in the upper right corner of the widget):
- RMS values

peak values

marked peaks

The calculations will appear to the right of the graph.