Control Properties
Control properties are applicable to all widgets in DewesoftX. They will help simplify creating a complex view of acquired and calculated data on the display screen. For more information on displays, please refer to the Display Manager and Display Settings pages of the manual, as well as their subpages.
Control properties allow you to do the following with widgets:
- Create a group and add/remove widgets to/from group
- Define the number of columns in a group
- Define transparency of widgets
- Define unified properties (same settings for each instrument)
- Check data presentation status
Create a Widget Group and Add or Remove
The rest of this page refers to widget groups made of only one widget type. For more general information on widget groups, please refer to our screen editing manual.
Placing multiple widgets of the same type can be lengthy, which is why Dewesoft allows you to shorten this process via the Controls section to the left of the screen. Place the first widget, and click the + button until you reach the desired number of widgets. They will be automatically grouped and aligned. Given that the assigned channel to each one will be the next channel on the Channels list, reassign channels if needed.
Example - digital meter:
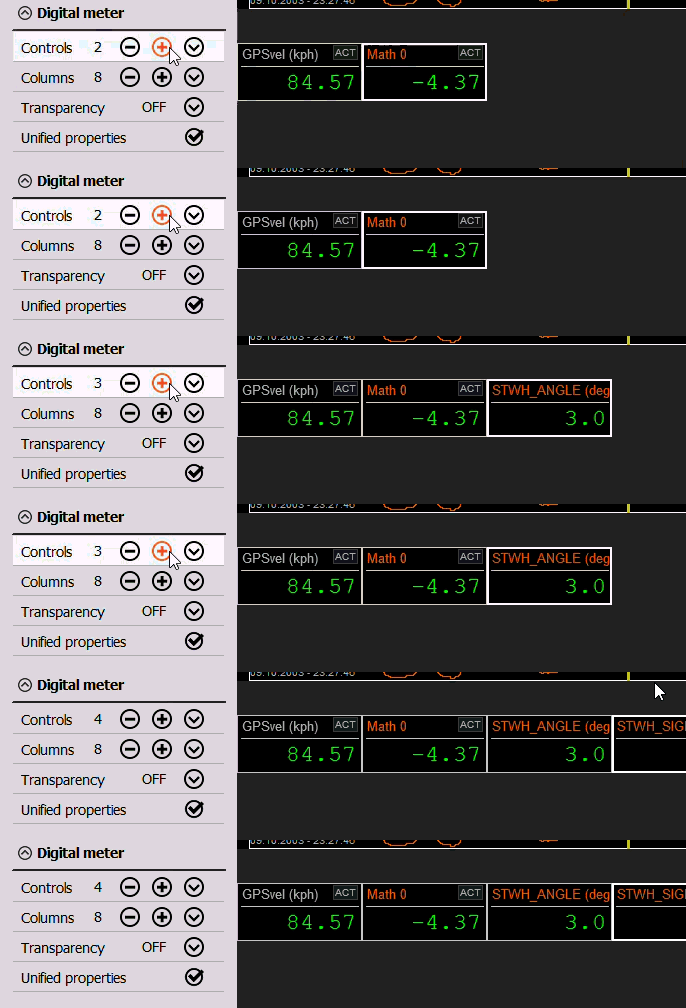
To remove widgets, select a widget and press the - button. The selected widget will be removed and the one to the right of it will be selected (if applicable).
Number of Columns
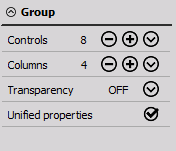
You can define how many columns of widgets should be allowed, i.e. after how many widgets to start a new row.
Transparency
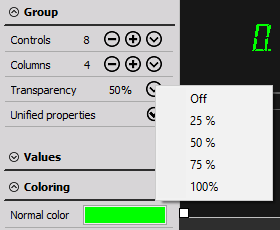
Setting transparency on a widget is the same as setting it on a single one. You can set it to none, 25%, 50%, 75% or full transparency from the dropdown menu on the left.
Unified Properties
By default, all widgets in a group created via the Controls setting will have the same properties - all properties are unified within a widget group.
However, you can use the Unified properties checkbox to allow different settings for each instrument within the selected group.
Data Presentation Status
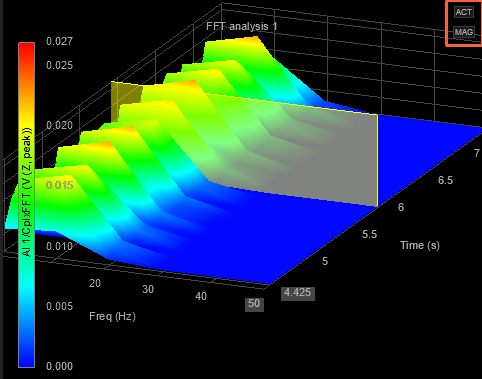
The data presentation status is located in the top right corner of a widget. If you click on it, you will get additional information about the type of data displayed.
- AVE - average
- RM - RMS value
- AC - AC RMS value
- MIN - minimum value
- MAX - maximum value
- P-P - peak to peak value
- ACT - actual value (current value)
- MIX - actual and reduced value; when storing option is set as Fast on trigger
- RDC - reduced values (on Recorder, 3D graph widget & Scope widget)
- +PK - absolute maximum
- -PK - absolute minimum
- SEC - time value (elapsed time on Digital meter)
- HEX - hex value
- HEX-R - raw hex value
- BIN-R - raw binary value
- MAG - magnitude of complex channel
- DEG - phase displayed in degrees (either from -180° to 180° or 0° to 360° )
- RAD - phase displayed in radian (from -$\pi$ to $\pi$)
- RE - real part of a complex channel
IM - imaginary part of a complex channel
Multiple data presentation statuses can appear in some occasions on Recorder or 3D graph.