CA p-v
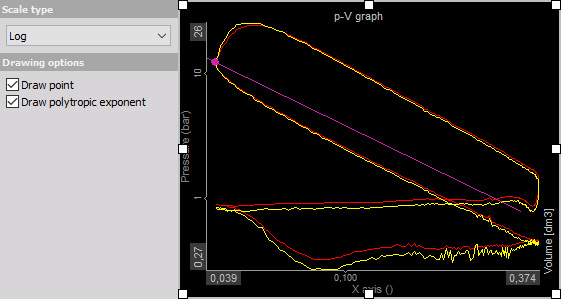
The Dewesoft Combustion analysis p-v plot shows the x-y scope volume vs. pressure in the cylinder. The combustion math module should be used that this graph can be chosen.

When you select p-v plot in the design or run mode, following settings will appear on left part of the screen:
- Control properties - For detailed information about Control properties: grouping, number of column, Add / Remove, transparency,…see -> Control properties.
- Scale type - Describes the orientation of the sensor
- Drawing options - There are two basic graph types - Normal, where the inputs are any analog channels, or from Order tracking, where the inputs are only the channels which are used in Order tracking math module. Available appearance setting for CA p-v graph in Run mode are: Axis scale/auto scale (Common instruments tools), Online calculation
- Channels selector - For detailed information about assigning/reassigning channels -> see -> Display settings.
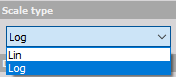
Scale type
The scale can be displayed either as linear or logarithmic (for volume and pressure). Linear axis is common used type for seeing the real value of the pressure, while logarithmic have two advantages: the pumping cycle can be seen very nicely and also the polytropic expansion and compression are linear in log-log scale.
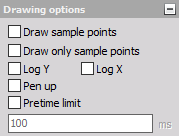
Drawing options
We have also an option to draw start of combustion and end of combustion points. This shows the points where start of combustion and end of combustion happens (calculated from the heat release).
Additional option with logarithmic scale is to display the Polytropic exponent. This is used to see how good the entered polytropic coefficient fits to the measurement data.