Graph Settings
Single / Multiple Time Axes
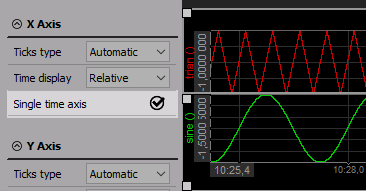
Dewesoft offers two different time base types for multiple graphs: single time axis or multiple time axes. Use the Single time axis checkbox to change between these two modes. Make sure that the Controls number is equal to the number of axes you wish to have.
- Single time axis
The advantage of a single time axis is to have more space to display the data.
- Multiple time axis
The advantage of multiple time axes is that it is easier to read time-related information.
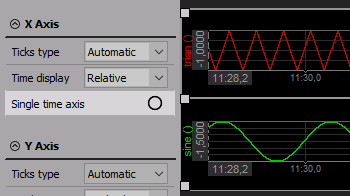
The appearance of the y-axis will remain the same.
Time Axis Type
You can select either absolute or relative time for the time axis for each graph. Click on the graph to select it and then use the Time display dropdown menu on the left of the screen.
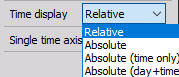
- Relative - elapsed time since the start of acquisition
- Absolute - current date and time, compatible with timing information according to UTC
- Absolute (time only) - current time only
- Absolute (day + time) - number of the day in the year and current time
Grid Resolution
To make analysis easier, Dewesoft offers the possibility of changing the type of grid ticks. Ticks are the white lines which divide the graph area into sections. Depending on range and signal, you can change the ticks type from Automatic (set by default) to Step or Divisions.
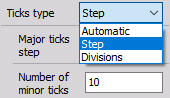
- Automatic - Dewesoft will automatically choose the optimal grid
- Step - a major tick will appear every __ time units, with __ minor ticks between two major ticks
- Divisions - there will be __ major ticks on the screen
Display Type
Your acquired signal may not be just a static signal, which is why all widgets offer different display types. You can quickly see the selected data type by looking in the upper right corner of the widget as well.
Example - Digital meter:
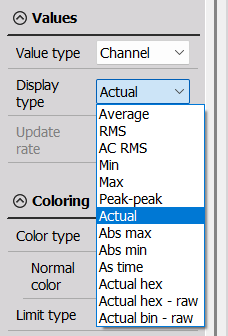
WARNING: Be aware that these display types represent only statistic values for the online display. The settings have no influence on the other displays or data storage.
Average Time
With the Update rate dropdown list, you can define the update rate for the selected instrument. The default rate is Fast (0.1 s), meaning that values will be calculated over a period of 0.1 seconds, which represents the internal minimum calculation period as well.
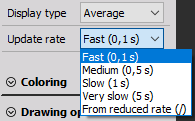
The system will still run at the dynamic sample rate and Dewesoft will acquire the data with full speed, calculate minimum, maximum, average, and RMS for this time interval, however, not every data point will be displayed on the instrument and stored, only the calculated values.
When From reduced rate is selected, the system will reduce the data continuously according to the static/reduced rate selected. For more information, please refer to Storing: Static/Reduced Rate.
Upper & Lower Limits
You can set high and/or low alarm limits for each instrument, which will change the color te of instrument number to a selected color when it is either above the high limit or below the low limit. Use check boxes to activate/deactivate high or low limit detection. If enabled, you can set the level for each.
Example - digital meter:
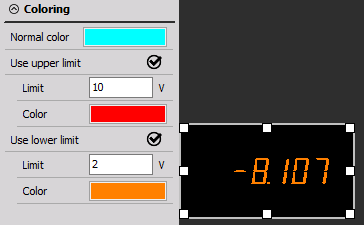
We want to use both limits - we have checked both Use upper limit and Use lower limit . The display will change when the signal either falls below 2 V or rises above 10 V
By default, the normal color is green and both limits are red. To change color, click on the color box that you want to change. You will be able to pick from predefined colors or you can make your custom color palette.
NOTE: The upper and lower limit is only a visual effect; it is completely independent from the Alarm monitoring function.
Please refer to Alarms and Channel Limits for more information.
Minimum and Maximum Shown Value
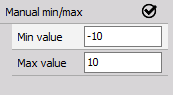
You can define a Minimum and a Maximum shown value for the vertical/horizontal bar graph. This feature is very important in order to get better scaling for the display. Just check the Manual min/max field and enter both values - the bar graph scaling will change immediately.
For example, if your temperature measurement range is from -50°C to 50 °C, but you only measure between 0°C and 5 °C, you can set the shown values accordingly:
Run Mode Time Axis Scaling
Use the plus and minus symbols to expand or compress the time axis. Clicking minus will show more time across the graph.
You can only zoom in/out with plus and minus buttons on vertical instruments (Vertical Recorder), except Time axis is vertical.
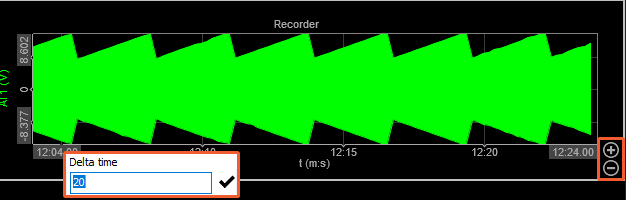
NOTE: Zooming into the recorder can only be done in Run-time mode.
You can show the entire recording, regardless of how long it is! Even days and days of data can be shown here. To enable this, you need to check Auto-scale for the X-Axis.
Changing the Y-axis Scale/Auto Scale
NOTE: Changing the y-axis this way is only available in Run mode.
If you want to change the y-axis, the Recorder offers two possibilities:
- Enter values
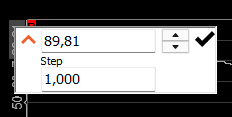
Entering the values is possible when the cursor has the following appearance:

Click on the numbers at both extremes and then type in the new numbers. You can also change the step if you click on the arrow on the left. When you’re done, click the checkmark on the right.
- Auto-scale
Move your cursor to the axis scale. When you reach the auto-scale area, the cursor changes to the following appearance:

Left click activates auto-scale and right click disables it.
WARNING: The auto-scale function uses the minimum and maximum value of the currently displayed signal for scaling. The scaling will be updated only when you left click!
Additional Scaling Functions
Dewesoft offers additional scaling functions accesible by using the following shortcuts:
- Left-click - scales the selected channel to the current min and max value(see also above).
- CTRL + Left-click - Selects all channels assigned to one widget and scales the Y-axis to the same maximum and minimum (highest and lowest value within all channels).
- CTRL + ALT + Left-click - Selects all assigned channels in one widget group (can be more than one widget) and scales each channel to the same maximum and minimum (highest and lowest value within all channels).
- CTRL + Manual min/max - change the max or min value of y-axis to the defined custom value for all the asigned channels on a single widget.
- CTRL + ALT + Manual min/max - change the max or min value to the defined custom value for all the assigned channels in one widget group.
- SHIFT + Left-click - Scales the assigned channel symmetrical around zero (± values are the same).
- CTRL + SHIFT + Left-click - Scales all assigned channels symmetrical around zero (all ± values are the same)
- Right-click - scale the assigned channels,to the default minimum and maximum (see also above).
- CTRL + Right-click - Selects all assigned channels fand scales each channel to its default maximum and minimum
Simple Measurement Cursor Functions
NOTE: This way of displaying x- and y-axis information can only be done in Run mode.
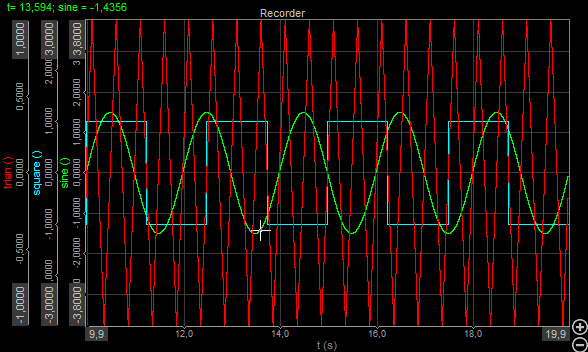
If you move the cursor over the signal, a white cross showing the current position of the measurement cursor appears. The cursor readout is displayed above the graph and shows:
- x-axis information - the absolute or relative time at the cursor position, depending on the selected time axis type
- y-axis information - the signal value at the cursor position, including units
As one graph may contain up to four signals, the measurement cursor will “pick” the closest graph.
Example - horizontal graph:
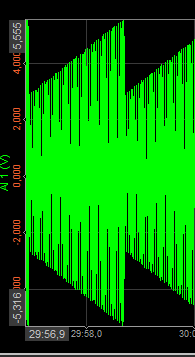
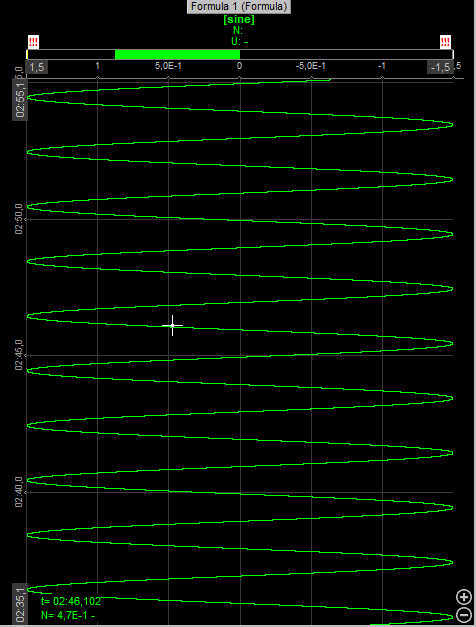
Vertical graph cursors are similar in appearance, with the differences being:
- The x-axis information is the signal value at the cursor position
- The y-axis information is absolute or relative time at the cursor position
- The cursor readout is displayed below the graph
Example - vertical graph:
WARNING: The measurement cursor is not available when the time base is set to too short a time.
Line Thickness
The default line thickness is defined in the User Interface Settings, but the user can always override the default value in Measure or Analyse mode for a specific widget only. The line thickness can be adjusted for multiple widgets, such as Recorder or 2D graph.
Copy Widget Properties
When you are done setting all the propreties of the current widget, you can reuse those settings and apply them to another widget.
To copy widget properties, you need to be in Design mode. Right-click on an already set widget and select Copy to clipboard and Widget group. You can also use the keyboard shortcut Ctrl + C to copy widget properties.
Go to the widget you want to apply settings to, right-click, and select Paste special and Widget group props. All properties, including scaling, min/max of Y-axis and X-axis, line thickness, etc.. are now applied to the second widget as well.