Modal Circle
The Modal Circle widget is used for damping estimations of simple structures. Simple structures are here defined as structures with well separated modes (not overlapping modes) that can be treated as individual SDOF systems (Single Degree Of Freedom), similar to modes shown in the FRF graph example below:
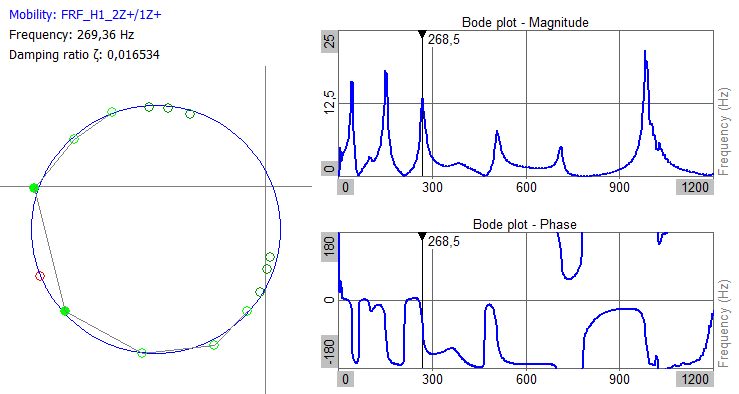
The Modal Circle widget determines the damping and resonance frequency based on an FRF channel (Frequency Response Function) and is therefore commonly used together with the Modal Test module, which calculates such FRF results.
FRF sample points laying around a resonance will be positioned in a circular pattern when seen on a Nyquist plot, which has a real and an imaginary axis. The Modal Circle widget shows such a Nyquist plot together with a circle fitted to those Fit points. The circular shape of points arises due to the phase changes that happen around resonances.
Widget Properties
All widget parameter are described in the sections below:
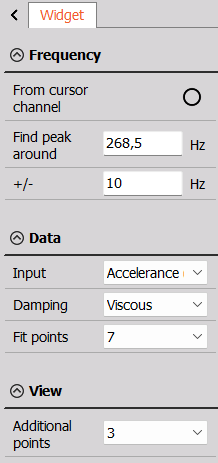
From cursor channel

The yellow cursor on the 2D graph is taken for frequency point determination. When From cursor channel is enabled, you can use the yellow cursor in a 2D graph and set it around the frequency content of interest. The Modal Circle will find the nearest peak (resonance) and fit the circle into that data set. Then it will calculate the damping factor and more exact frequency (between line resolution of FFT).
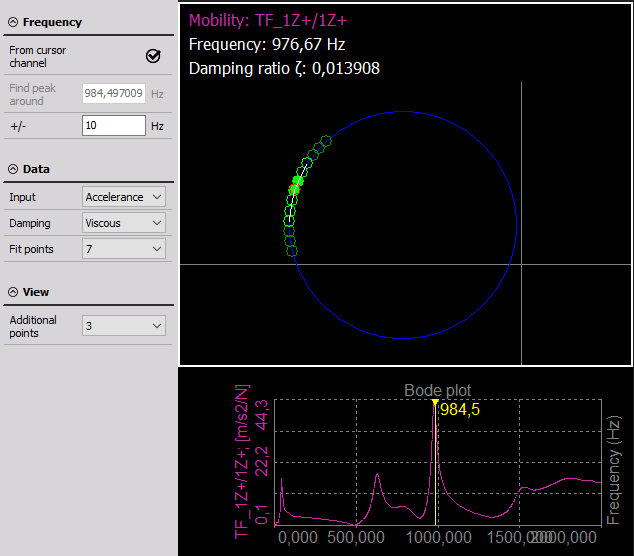
Find peak around

The Find peak around parameter is active when the From cursor channel is disabled. With Find peak around you can manually enter a frequency point for the circle fit procedure.
Peak search range (+/-)

The greatest peak in the defined frequency interval around the selected point will be used for the circle fit determination.
Input (physical quantity)

The Input type must be set in accordance with the physical quantity of the selected FRF channel. For example, if the used FRF channel has the unit [g / N] or [m/s^2 / N] then select Accelerance, which is the physical quantity for acceleration over force.
The selected Input must match the unit of the used channel in order to properly convert the channel into the domain where we need to fit the circle.
Damping and Resonance frequency calculations

The DEWESoft Modal circle widget lets the user choose between a structural and a viscous damping model:
- The structural damping model is based on the receptance and calculates the damping loss factor, eta $[\eta]$.
- The viscous damping model is based on the mobility and calculates the damping ratio, zeta $[\zeta]$.

If the Input FRF channel has another physical quantity than the selected damping model uses, then the Modal Circle widget first automatically integrate or differentiate it to get the correct form.
Resonance frequency determination
To determine a resonance frequency $f_r$, first a circle is fitted to N number of FRF Fit points around an FRF resonance peak. Next, $f_r$ is determined by the fitted Circle center, the Complex plane origin position, and the two Fit points closest to the resonance frequency, one below $B$ and one above $A$ with respect to frequency:
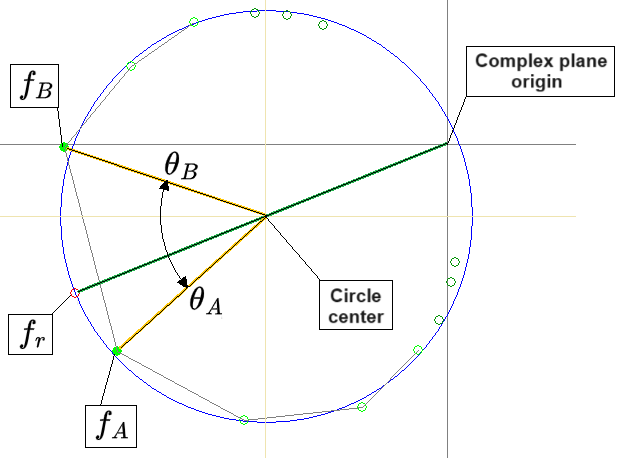
From the picture above, the determined Resonance frequency $f_r$ is marked with a red circle point. $f_r$ is found on the fitted blue circle at the position where the green line crosses over. The green line is a line going through the Complex plane origin and the fitted circle center.
Described with a formula this can be written as:
$$f_r= \frac{\theta_A \cdot f_B - \theta_B \cdot f_A}{\theta_A - \theta_B},$$
where points $A$ and $B$ are the points just After and just Before the resonance frequency. $f_A$ and $f_B$ are the frequencies of those points, and $\theta_A$ and $\theta_B$ are angles between the green line to $f_r$ and the orange lines from the Circle center to point $B$ and $A$.
Structural damping model
In a Structural damping model, the Receptance $\alpha(f)$ forms a perfect circle on the Nyquist plot. The receptance can be formulated as:
$$\alpha(f) = \frac{X(f)}{F(f)} = \frac{1}{4\pi^2f_r^2 \left(1- \left( \frac{f}{f_r} \right) ^2+i \eta_r \right)}$$
This receptance formula is used to determine the formula for the damping Loss factor $\eta_r$ of a mode, based on the Fit points $A$ and $B$ closest to $f_r$:
$$\text{Loss factor} = \eta_r = \frac{f_A^2 - f_B^2}{f_r^2 \cdot \left( \left| \text{tan} \left( \frac{\theta_A}{2} \right) \right| + \left| \text{tan} \left( \frac{\theta_B}{2} \right) \right| \right) }$$
Viscous damping model
For the Viscous damping model, we used the Nyquist plot of Mobility $Y(f)$ which in a similar manner then forms a circle-like curve around the resonance. The mobility can be formulated as:
$$Y(f) = \frac{\dot{X}(f)}{F(f)} = \frac{if}{2\pi f_r^2\left( 1 - \left( \frac{f}{f_r} \right)^2 + 2i \left( \frac{f}{f_r} \right) \zeta_r \right) }$$
This mobility formula is used to determine the formula for the Damping ratio $\zeta_r$ of a mode, based on the Fit points $A$ and $B$ closest to $f_r$:
$$ \zeta_r = \frac{f_A^2 - f_B^2}{2 f_r \left(f_A \cdot \left| \text{tan}\left(\frac{\theta_A}{2} \right) \right| + f_B \cdot \left| \text{tan} \left( \frac{\theta_B}{2} \right) \right| \right)}$$
Fit points
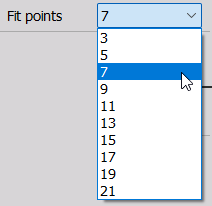
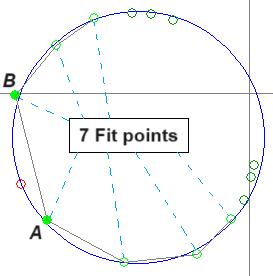
Select how many FRF sample points around the select frequency to use in total for the circle fit determination.
All used Fit points are marked with a light green circle edge, whereas the circle points $A$ and $B$ closest to $f_r$ are also filled out with that light green color:
Additional points
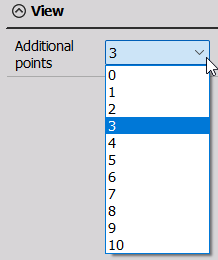
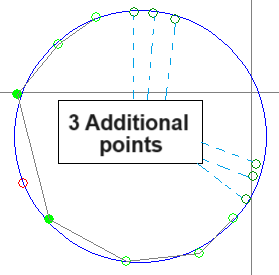
Select how many additional FRF points to show on the Nyquist plot. These points will not be used by the Modal circle widget for the determination of damping and resonance frequency, but can help indicate how uncoupled a mode is from other neighbor modes.
The Additional points are marked with a dark green circle edge, and the selected number of Additional points will be shown on each side of the resonance frequency.
References
- Modal Testing: Theory, Practice and Application, 2nd edition, year 2000, by D.J. Ewins, page 312-313.
- MODAL TESTING, Ostrava 2011, by Alena Bilošová, page 97, weblink:
https://moodle2.units.it/pluginfile.php/75129/mod_resource/content/1/EMA.pdf