Modal test
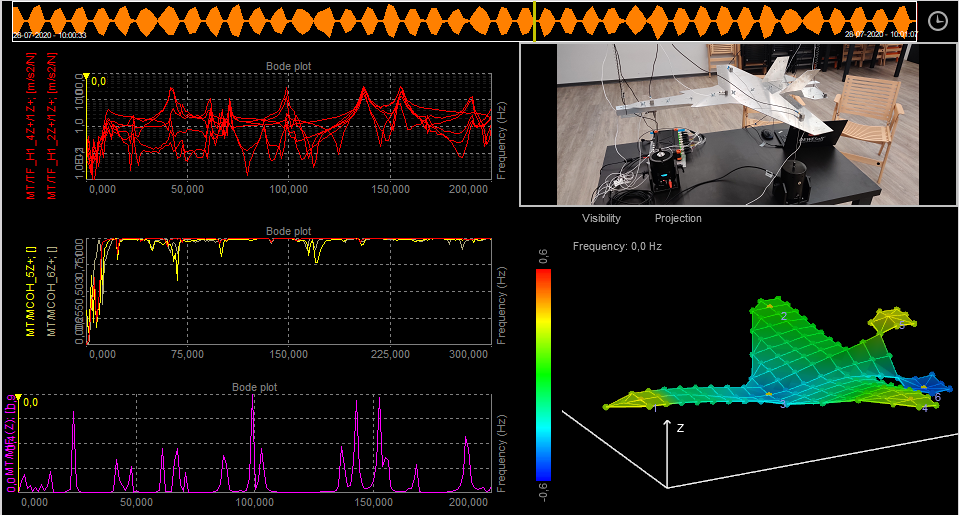
For more information about Modal test with Dewesoft, take a look at the Modal test and analysis manual.
For a general guide to Modal test and analysis, take a look at What is Modal Analysis: The Ultimate Guide.
Modal test is a process to determine the transfer characteristic of a system, FRFs (Frequency Response Functions). FRFs are used to find the natural frequencies, damping ratios and mode shapes of mechanical structures using hammer or shaker excitations. FRFs are also the
- Required hardware: Sirius, Dewe43
- Required software: Dewesoft DSA or SE, PROF and FRF option
Modal test (introduction)
Modal test is a mathematical module that allows us to calculate the transfer function ($H$) between two signals.
$$ H = \frac{\text{Output}}{\text{Input}} $$
Input and Output signals are usually mechanical or electrical nature. Mechanical means exciting structure with hammer or shaker and measure response with an accelerometer. Electrical can be for example input and output voltage of the amplifier in order to get transfer function of the amplifier.
Transfer functions $H$ are also refered to as FRFs (Frequency Response Function), and is a relation between two signals in a complex form (real and imaginary vs frequency).
Data collection:
Calculations can be done in three ways:
Setup
For instructions on how to Add new module see Add module.
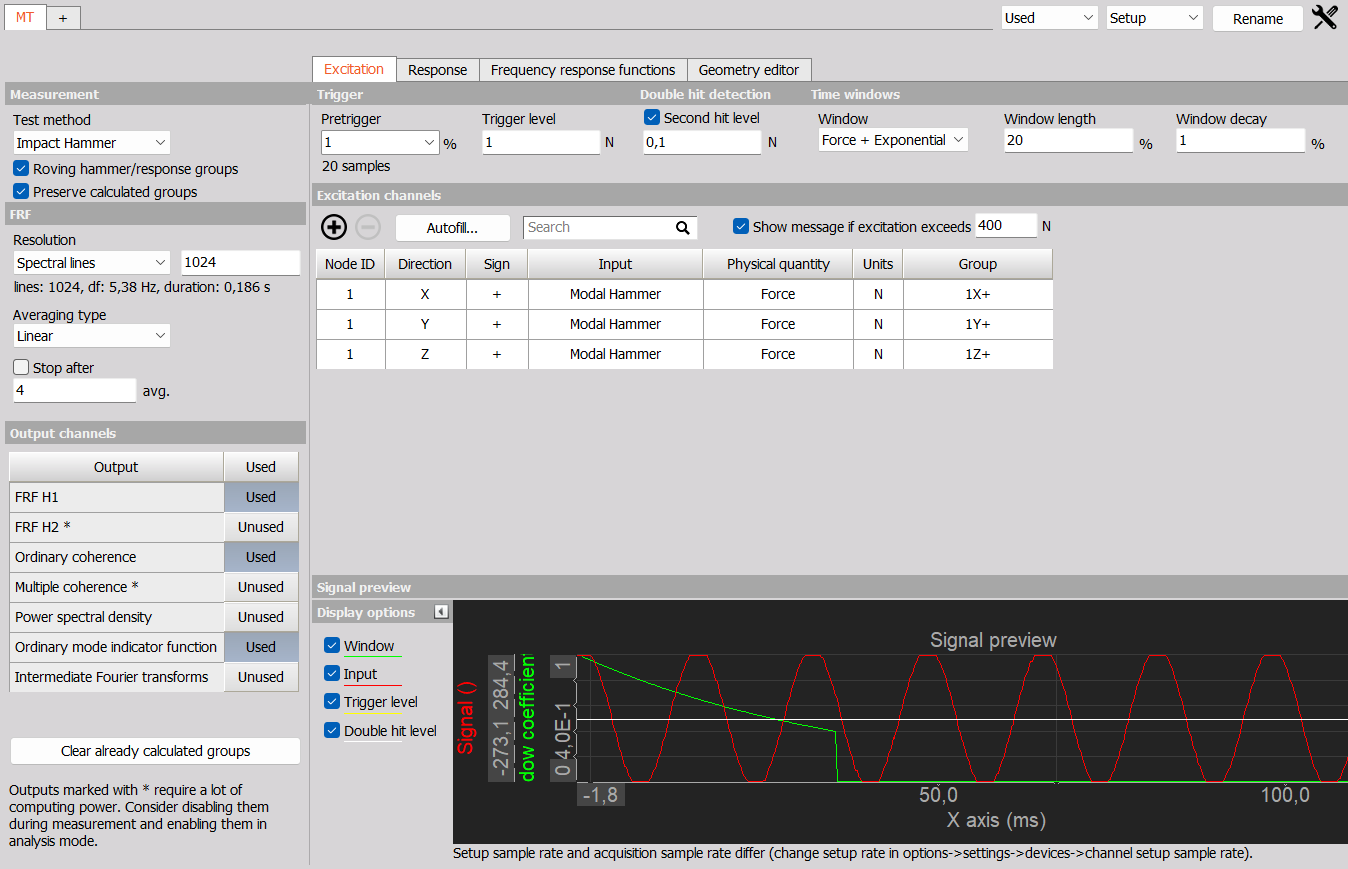
Calculation
Transfer function is calculated via the standard Frequency response function algorithm or FRF for short. It is possible to calculate all excitation/response pair at once or in groups.
Test method
- Impact Hammer - In triggered acquisition, blocks of data are taken when trigger level is exceeded by hammer impacts on the structure. Output and input measurements are used to calculate FRFs.
- Shaker - Depending on the selected waveform used for exciting the structure, blocks of data can be taken continuously, or when triggered. Output and input measurements are used to calculate FRFs.
- ODS (Operational Deflection Shapes) - Blocks of data are taken continuously, and only responses are measured. Since ODS do not use input excitations H functions calculates transmissibilities instead of FRFs. ODS is used for animation of deflection shapes.
Use one excitation channel and several response channels or several excitation channels and one response channel in a single measurement.
Do multiple measurements with one or more excitation points to measure one or more responses.
Preserve calculated groups
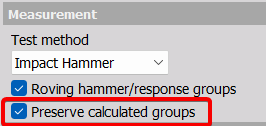
Below the Test method you have the option to ‘Preserve calculated groups’. If this is disabled earlier measurements will be cleared and all results reset everytime going to Measure mode.
FRF estimator
- H1 - The most commonly used estimator is the H1-estimator, which assumes that there is no noise on the input and consequently that all the input measurements are accurate. All noise is assumed to be on the output.
- H2 - Alternatively, the H2 estimator can be used. This assumes that there is no noise on the output and consequently that all the output measurements are accurate. Noise is assumed to be only on input.
FRF resolution
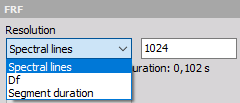
The resolution of results can be detemined with selecting:
- Spectral lines - The number of lines for FFT (block size equals two times lines).
- Df [Hz] - delta frequency, frequency resolution of the results.
- Segment duration [s] - duration of the block segment.
FRF (frequency response function)
Averaging type - Select the averaging type from Linear, Peak, Exponent
Stop after - Stop after the set number of averages
Stop after
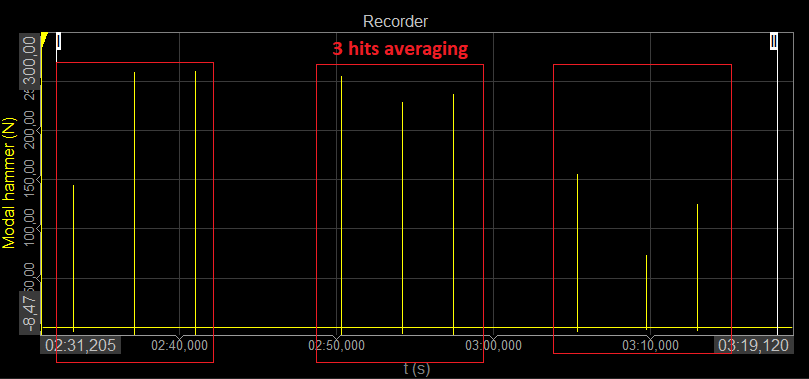
Select the check-box to enable Averaging and input the maximum number of measurements. This will enable you to take the predefined number of measurements and average them for a combined result. If the number of averages is not reached, the result will be calculated from the completed measurements. After the number is reached, you will not be able to do additional measurements for that group.
Output channels
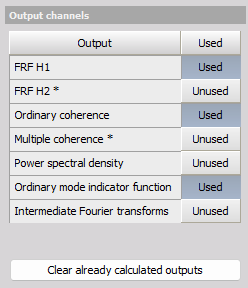
- FRF H1 - as described under FRF estimator.
- FRF H2 - as described under FRF estimator.
- Ordinary coherence - is a real value between zero and one. If the value is one then response power is caused totally by input power. A value less than one indicates that measured response power is greater than that from input power, due to other sources such as noise.
- Multiple coherence - used in MIMO calculation. If the value is one then the response power is caused totally by the multiple input’s power. A value less then one indicates that measured response power is greater than that from input power, due to other sources such as noise.
- Power spectral density - Power Spectral Density (PSD) is the measure of the power product of channels, over frequency. CPSD is the measure of the cross power product between response and excitation channels, over frequency.
- Ordinary mode indicator function - This type of Mode Indicator Function (MIF) is a function ranging from zero to one where higher values can indicate modes. MIF use all FRFs to determine where resonances are located.
- Intermediate Fourier transform - FFTs of excitation and response channels during the measurement.
Next to the output functions above additional functions used to measure operational deflection shapes are supported and described under ODS.
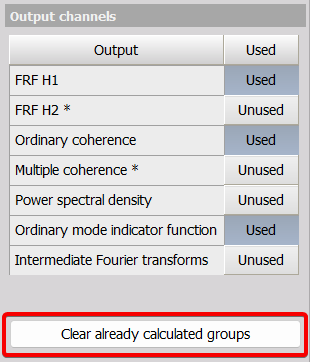
Clear already calculated groups
Then the parameter ‘Preserve calculated groups’ are enabled calculated results will be kept until you reset the group or click on the ‘Clear already calculated groups’ button.
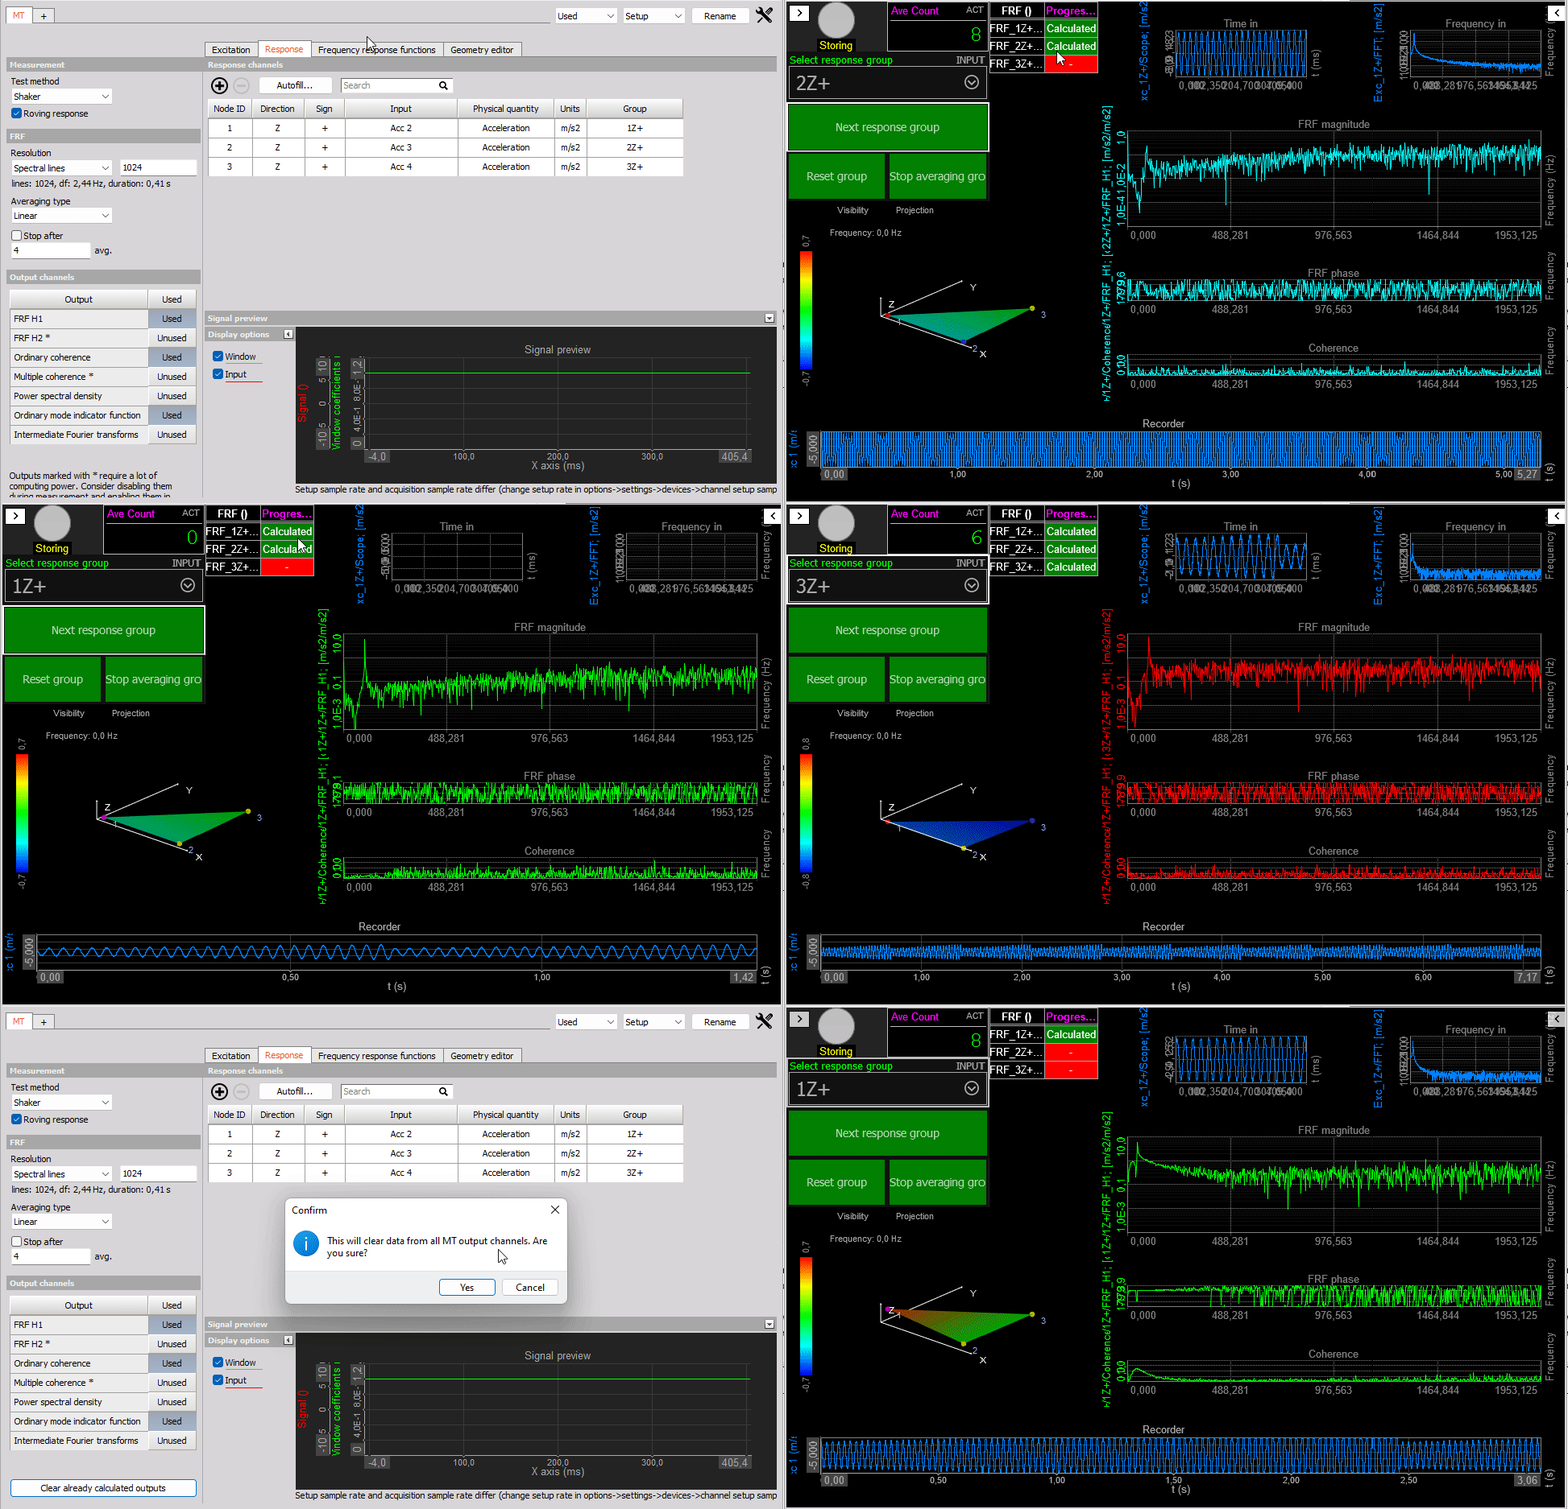
With DEWESoftX Modal Test you do not need to finish a complete test in one go - you can stop the work at any time and continue later on. You can also change certain modal test setup parameters during test campaigns, for example adding more DOFs to measure, after the test has started.
Functions already calculated are stored with the related setup file and data files. That means, if FRFs for some of the DOFs have been measured and the setup is saved, then next time you open that setup you can continue measuring the remaining missing FRFs. You do not need to start all over - only if you want.
If you want to reset and remove all previously measured functions then press the ‘Clear already calculated outputs’ button. This button will only be visible if some output functions have already been measured.
Considerations regarding number of outputs
With certain configurations you might end up with a large number of FRFs and other output types. This could for example happen for a Shaker test which is set up with hundreds of tri-accelerometers and multiple shakers, or it could be when performing an Impact hammer test where sensors are roving over hundreds of nodes while also having multiple references.
In such cases you will get many outputs since each output type will provide a result between each defined Excitation DOF channel and Response DOF channel. For example, 50 tri-acc and 3 shakers gives 3 excitation reference channels and 150 response channels, which in total creates 3 x 150 = 450 result channels per output type, for types like FRF H1 and ODS FRF.
If the number of outputs get high enough it might affect the performance critically and therefore a warning text will appear when it could begin to be an issue. The text says:
Warning: Performance might be affected critically due to the large amount of outputs. Consider performing the measurement in parts.

In such cases please consider to split the full test into multiple test parts which have their own related setup file.
The full test can for example be divided into multiple test parts having individual reference DOFs, or into parts covering certain components / segments of the overall test object.
In some cases where only the first few modes are relevant to test it might also be sufficient to use a reduced number of measured nodes, that still provide the required spacial resolution to determine and validate the modes.
Impact hammer
Impact hammer triggering
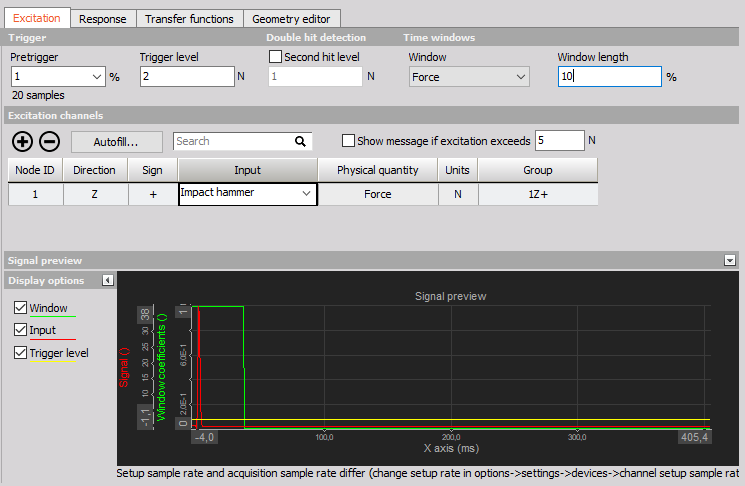
- Pretrigger: defines how much data will be taken before a trigger is reached (in per cent of block size). If this is set to zero we will probably miss some data on the beginning.
- Trigger level: trigger level defines the level that trigger channel must reach in order to recognize a hit
- Second hit level: after the actual hit, if the second hit level is reached, double hit is detected
Time windows

- Force: - this will aplly a rectanular window on the excitation channels with a Window length selected in % of the FFT block length. The response signals will have a rectangular window over the full FFT block, 100 % of the Window length.
- Force + Exponential: this will apply an exponential window on excitation and response channels with a Window decay over the FFT block set in %. For the excitation channels the exponential window stops afte the set Window length, whereafter the excitation window is zero.
Double hit detection
Enable or disable second hit level detection with the check box and enter the desired value in the field below. The signal will be searched for peaks and if there is more than one peak which is higher than double hit detection level you will get a warning that double hit happened. You can check it on excitation spectrum. Then you can reject this measurement or continue.

Shaker
Excitation source
External - Shaker is controlled by an external signal
- Burst - define the pretrigger, trigger level and windowing
- Continuous - define the FFT window and overlap
Dewesoft AO - shaker is controlled (open loop) by Dewesoft’s Function generator (Analog Out)
- Continuous random - define the FFT window and overlap
- Burst random - define the excitation duration (in % of the FFT block segment duration), pretrigger and trigger level
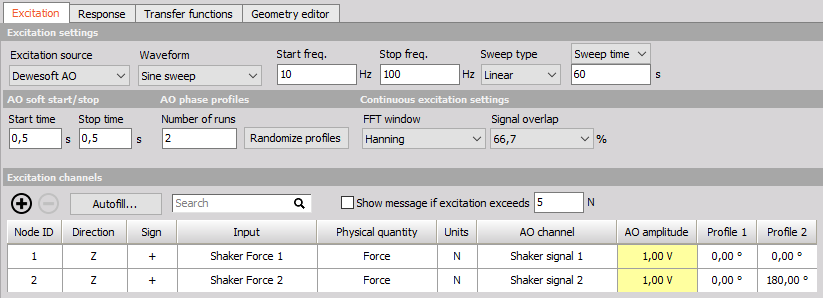
- Sine sweep - define the start and stop frequency, the sweep time, and if the sine should sweep linear og logarithmic. With use of multiple shakers multiple number of sweep runs are required having different AO phsae profiles.
All AO Function generator can be defined directly in the Modal test module:
Operational deflection shapes (ODS)
The ‘Test method’ ODS referes to Spectral ODS where deflection shapes can be animated across a frequency axis.
Settings are similar to the Shaker method, except that we can’t use the Function generator and we are limited to one Reference “excitation” channel.
With spectral ODS, one of the accelerometers is selected as the reference channel and other are selected as response channels.
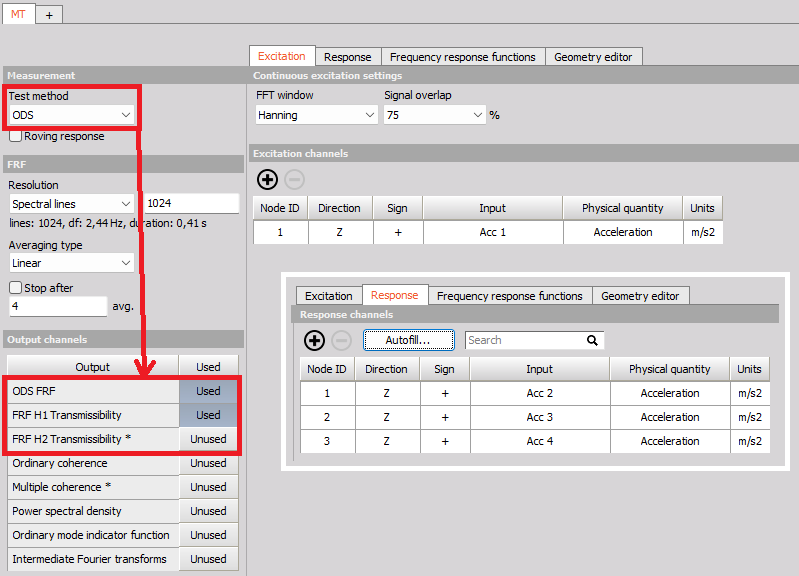
The main output result from Frequency ODS testing is the absolute ODS function named ‘ODS FRF’. The ODS FRF function is also known as ‘phase-assigned spectrum’, ‘PAS’, or ‘phase-referenced spectrum’. ODS FRFs contains the magnitude of the response while having the phase between that and the reference response.
The relative ODS outputs are shown as the FRF H1 and H2 Transmissibilities, which have a magnitude related to the ratio between the response and the reference response.
For information about Time ODS where deflection shapes are animated across a time axis, see Time ODS.
Excitation and response channel settings


Show message if excitation exceeds - provides safety for avoiding damaging the structure under test. When an excitation sensor exceeds the defined limit then AO outputs and the measurement are stopped.
Excitation and response configurations
- Node ID - the ID of a measurement node point on the test structure. It connects the a sensor to a dedicated point on the structure and on the created geometry.
- Direction - defines the direction (x, y, z) in which we measure a certain node point (related to animation of the geometry).
- Sign - defines the orientation of the sensor (+, -)
- Input - input channel that is physically connected (e.g. a force or acceleration sensor).
- Physical quantity - the physical quantity of the selected Input channel.
- unit - used unit for the Physical quantity of the selected Input channel.
- Group - define the measurement group when performing roving sensor measurements. All the sensors defined in the same group, wil be measured at the same time.
- AO channel - Dewesoft Analog Output channel which is used for a driving shaker.
- AO amplitude - amplitude of the selected AO channel
- Profile - phase of the selected AO channel, used for Sine sweep measurements. If multple shakers are used multiple runs with different phase profiles should be defined.
Signal preview
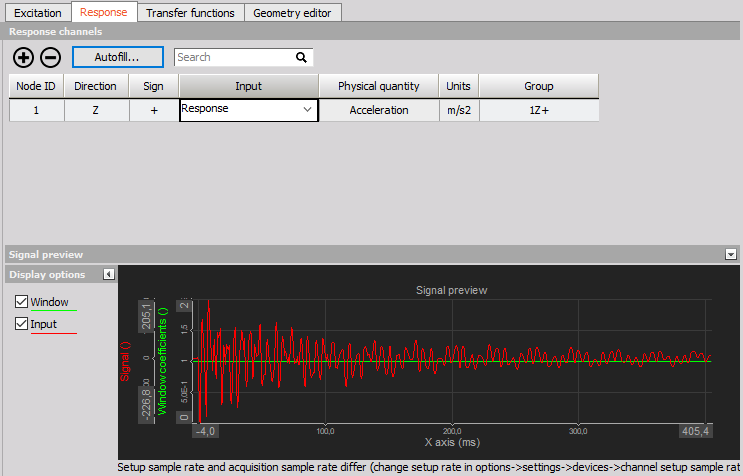
Directly in the Modal test module the excitation and response channels can be previewed.
With this preview you can correctly set the trigger level and windowing.
Autofill setup
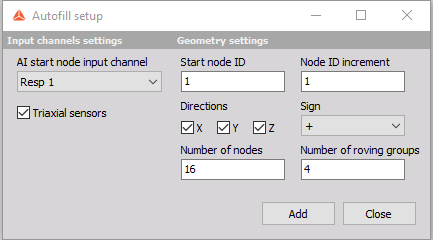
NOTE: If you wish to use Autofill (for response channels) for triaxial sensors you must connect the response channels (Triaxial accelerometers) in a manner of: 1st sensor X, Y, Z, 2nd sensor X, Y, Z, and so on.
Input channels settings
AI start node input channel - Select the channel that will measure the first node of the structure Triaxial sensors (only for response ch.) - If multi-axial sensors are used, check the box to define the used channels under Geometry settings / Directions
Geometry settings
- Start node ID - Define the starting point node of the structure
- Node ID increment - Set the increment by which the nodes will advance
- Direction(s) - Select the direction(s) of the measurement (if Triaxial response you can select multiple X, Y and Z)
- Sign - Define the orientation of the sensors
- Number of nodes - Define the number of nodes being measured at the same time (in same group)
- Number of roving groups - Define how many times the group of measured nodes is roving
For example, in the picture below 16 triaxial response sensors are roving 4 times, giving 3 (directions) * 16 (nodes) * 4 (groups) = 192 response channels.
Transfer functions tab
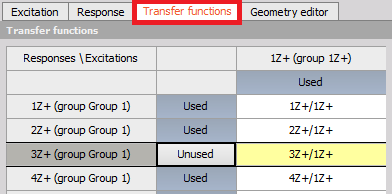
The transfer functions tab gives an overview of which transfer functions that will be calculated. For large test setups involving many sensor locations and multiple references the full set of transfer functions can be big. If not all transfer functions are required while performing measurements they can be toggled from ‘Used’ to ‘Unused’ to increase the performance.
In Analyze mode, when doing post-analysis, the ‘Unused’ transfer functions can be toggled back to ‘Used’ and recalculations can be done based on the acquired time data.
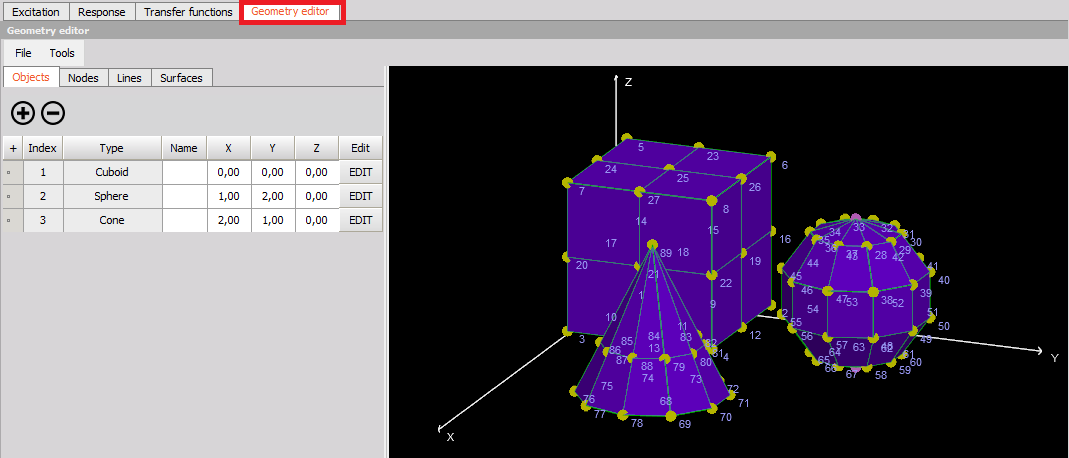
Geometry editor tab
Under the Geometry editor tab you can create or import a geometry that relates to the test. The geometry is mapped to the channels via the Node IDs. After connecting all nodes to channels the geometry can animate mode shapes and defection shapes depending on the used Test method.
For more information about how to use the Geometry editor see: Modal geometry.
Measure
The Modal Test (MT) module automatically creates pre-defined measurement displays.
In the predefined display you are able to see a progress table, manage measurement groups, FFTs of excitation and response channels, transfer functions, coherences and geometry.
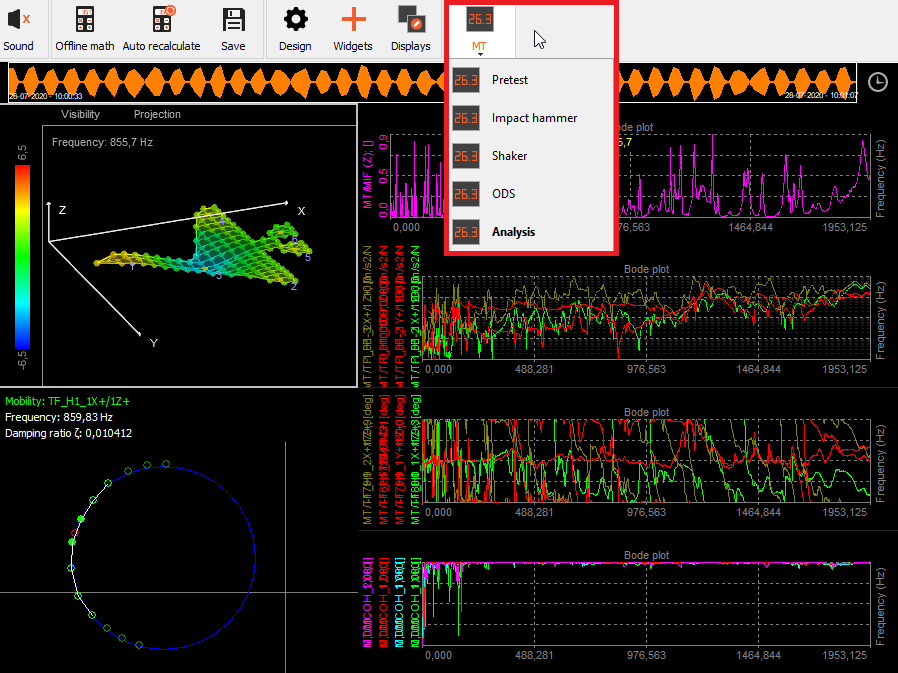
NOTE: If you later change the MT setup then the MT display templates need to be updated by right-clicking on the MT display icon and press Rebuild.
Animate the dynamics of the structure
To see geometry animations while measuring or when performing Modal post analysis, you can use the pre-defined MT display templates which includes a Geometry editor visual control widget.
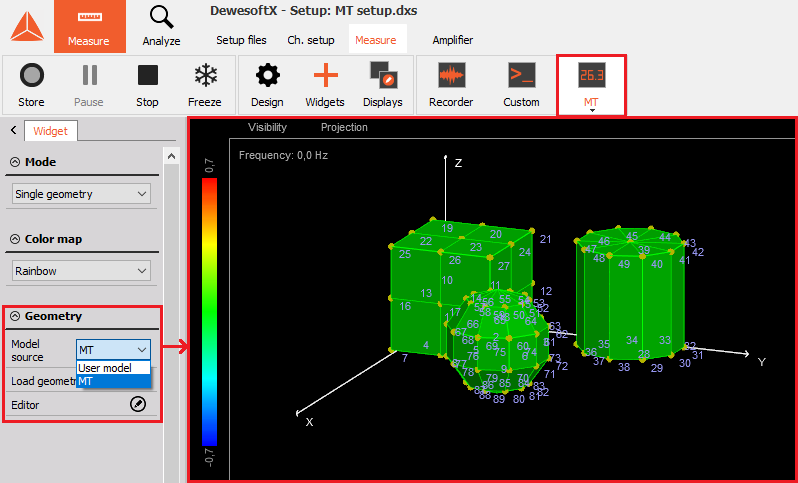
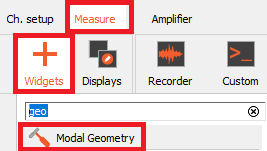
If you want to create your own display layouts then the Geometry visual control can be added under Widgets:
Progress table
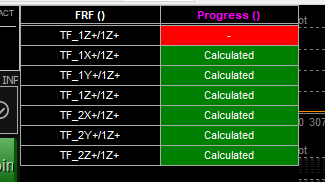
In the Pogress table all the FRF transfer function to be calculated are listed. When FRFs have been calculated it is indicated with text and a green background color. The indicator will remain red for FRFs not calculated yet.
2D graphs for FRFs, MIF and Coherence
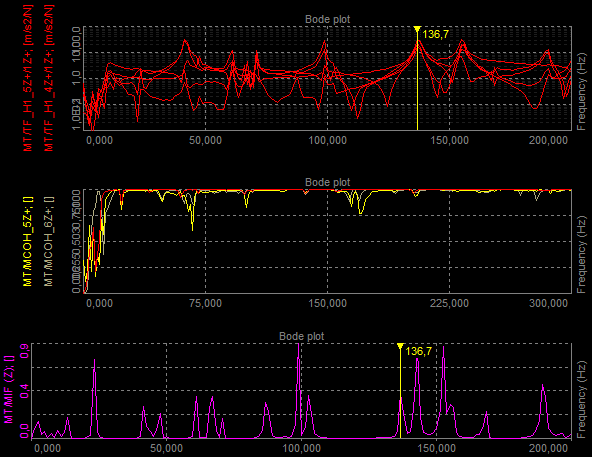
The 2D Graph widgets is the main visual control used for Modal Test results such as FRF, MIF and coherence functions. With 2D graphs such data values are shown over a frequency axis, which enables you to inspect resonances and correlations between excitation and response channels.
For more information about Modal results look at: What is Modal Analysis: The Ultimate Guide.
Modal Circle fit (damping estimation)
The Modal Circle widget is a simple tool for basic modal damping determination. More detailed information about the display widget is found on the dedicated Modal Circle help page.
You can use the yellow cursor in a 2D graph and set it to the frequency content of interest. Circle fit will find the nearest peak (resonance) and fit the circle into that data set. Then it will calculate the damping factor and more exact frequency (between line resolution of FFT).
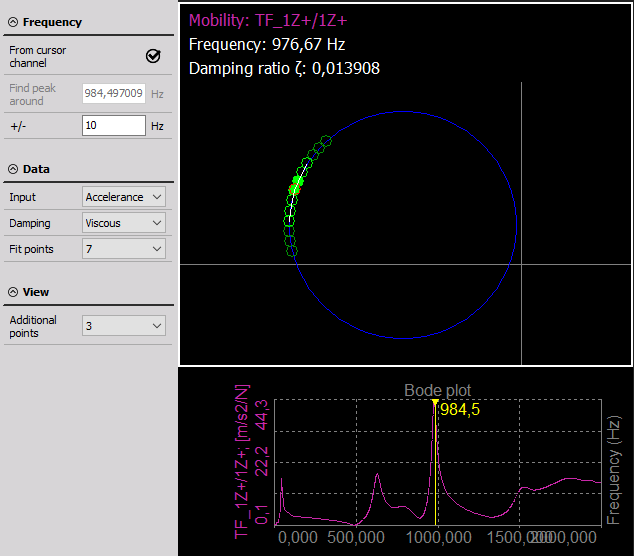
- From cursor channel - the yellow cursor on the 2D graph is taken for frequency point determination.
- Manual - you can manually enter frequency point for circle fit procedure.
- Peak search (manual mode) - an area in which we will search for peak for circle fit.
- Neighbour count - a number of neighbours taken into account when doing the circle fit.
Dewesoft Modal circle visual control lets the user to chose between the structural and viscous damping model and calculate either damping loss factor or damping ratio from receptance or mobility, after first integrating or differentiating the measured FRF to get the correct form.
If we assume a structural damping model, the receptance forms a perfect circle on the Nyquist plot. The contribution of other modes can be neglected.
For the viscous damping model, we used the Nyquist plot of Mobility which likewise forms a circle-like curve around the resonance.

Analysing FRFs from multiple datafiles
If you have to analyse a structure by using FRFs coming from multiple datafiles then this procedure is described under the section Merging mulitple datafiles found under the Modal Analysis help article.