Horizontal / Vertical bar graph
The Horizontal / Vertical bar graph is designed to give a graphical indication of the current value of a signal within the defined display range.

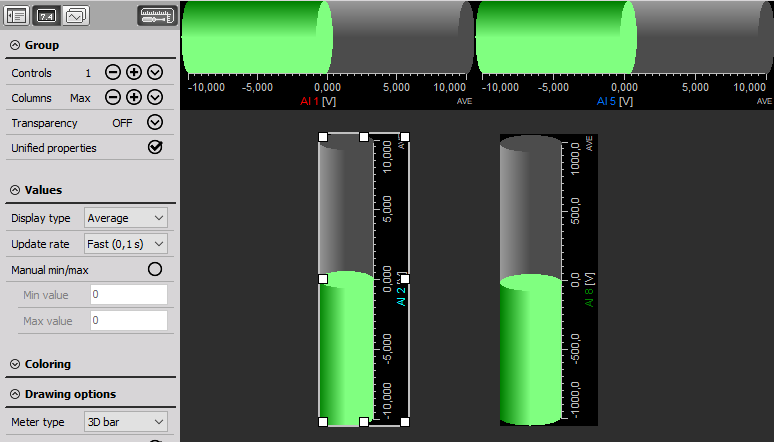
 When you select a Horizontal / Vertical bar graph in the design or run mode, following settings will appear on left and right part of the screen:
Control properties
For detailed information about Horizontal / Vertical bar graph Control properties: grouping, number of columns, Add / Remove instruments, transparency,… see -> Control properties.
Horizontal / Vertical bar settings
Typical settings (same for Horizontal and Vertical bar) are:
- Display type ->Common graph settings
- Meter type
- Average time -> Common graph settings
- Upper / Lower limit -> Common graph settings
- Minimum / Maximum shown value -> Common graph settings
- Channel selector
For detailed information about assigning / reassigning channels to Horizontal / Vertical bar -> see -> Display settings.
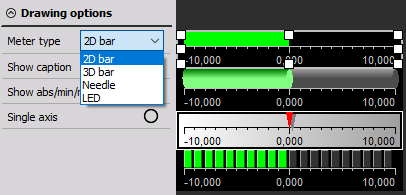
Meter type & Appearance on screen
The bar graph has four different basic appearances: as standard - Bar, 3D, Needle or LED bar graph and can be selected from the Meter Type drop-down list.
They all contain the channel name, display type and unit beside the measurement values.
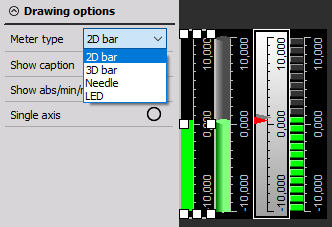
All bar graph basic appearances can be in:
- horizontal - Horizontal bar (see above)
- vertical format - Vertical bar (see below)
The orientation depends on the instrument type selected by the instrument icon in Design toolbar.
Changing the orientation is not possible; you have to select the right instrument when you click on the icon.
For detailed information about instruments positioning, size and transparency see screen edit functions > Instrument appearance.