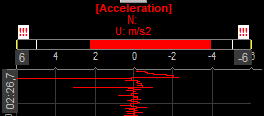
Vertical recorder
The Vertical recorder instrument is designed to emulate the time-history plotting capabilities of the traditional strip chart or recorder, but with vertical Time axis orientation and enhanced display. On each vertical recorder only one channel can be displayed.

When you select Vertical recorder instrument in the design or run mode, following settings will appear on left part of the screen:
Control properties
For detailed information about Recorder Control properties: grouping, number of column, Add / Remove, transparency,…see -> Control properties.
Vertical recorder settings
Typical Vertical recorder setting are:
- Single/Multiple Time axis ->Common graph settings
- Display type -> Common graph settings
- Time axis type -> Common graph settings
- X scale divisions
- Alarm levels
Available appearance setting for Vertical recorder in Run mode are:
- Time axis scaling -> Common graph settings
- X-/Y-axis information
- Common graph settings
- Channel selector
For detailed information about assigning / reassigning channels to/from Recorder -> see -> Display settings.
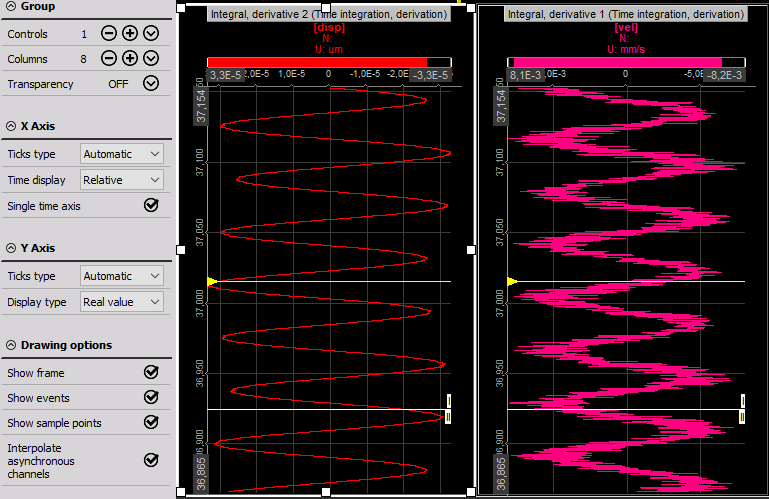
Appearance on screen
The Vertical recorder element offers all important information:
- channel number (group, description and slot)
- channel name(s)
- unit(s)
- time information
- zoom functions…
Appearance is like for Recorder, except Time axis is vertical.
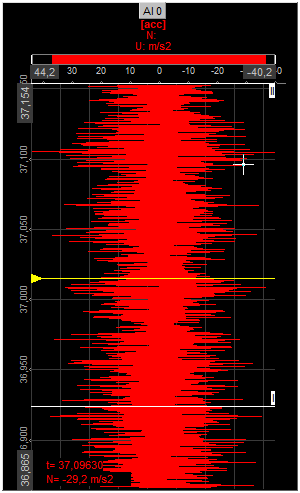
For detailed information about instruments positioning, size and transparency see -> Screen edit functions.
Run mode Changing the X-axis scale / auto scale
WARNING: This way changing X-axis can’t be done in Design mode -> available only in Run mode.
If you want to change the X-axis for any input, the recorder offers two possibilities:
- Enter values - You may enter the values by yourself - simply click on the number at both extreme and then type in a new number.
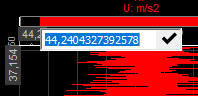
This is possible when the cursor has following appearance:

- Auto scale
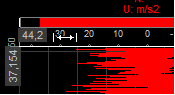
Move cursor to the axis scale. When you reach the auto scale area, the cursor changes to the following appearance:

Press left mouse button to activate auto scale for this channel or press right mouse button to undo auto scale. The auto scale function always calculates the minimum and maximum value of the currently displayed signal and use these values for scaling. The scaling will be only updated when you press the left mouse button!
Additional auto scale functions
Dewesoft offers additional auto scale functions when you press keys together with the left or right mouse button:
- Left mouse button - Auto scales the selected channel (see also above).
- SHIFT + Left mouse button Scales the selected channel symmetrical around zero (± values are the same).
- Right mouse button - Undo auto scale for the selected channel (see also above).
Display type
Display types of Vertical recorder are same as by Recorder, except Time axis type is vertical.
X scale divisions
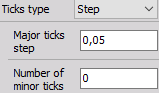
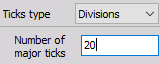
The Vertical recorder offers X scale types. You can select automatic, steps or divisions, if you choose the steps you have to define numbers of major ticks step and number of minor ticks, if you choose divisions you can choose from one to twenty (= dashed white line which divides graph area) from the drop-down list.
Alarm levels
You can set high and/or low alarm limits for each Vertical recorder, which will cause the recorder to mention the alarm above the grid.
As a standard, the alarm values are set to the minimum and maximum range for the appropriate channel. If you want to use own limits, just enter the alarm level according to your requirements.
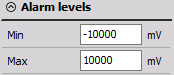
For example, if we want to supervise the signal within ±1 mm, we enter the following settings: -> see above.
Now we have set the limits to +1 and -1 mm, indicated by the two small white lines directly above the scale. The two yellow lines show the minimum and maximum value during this acquisition, which may be even outside the displayed time window. Finally, a line in the color of the channel indicates the current value; a small line indicates just small changes in the signal for the last 0.1 sec, the wider the line the higher the change in the signal.
Example 1 - The current signal is within the defined limits of ±1 mm, indicated by the two white markers.
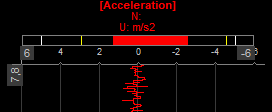
Example 2 - The signal is out of the defined limit, the current value (at the moment 1.37) is displayed in red letters as long as the signal is out of the limits.
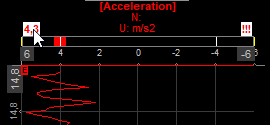
Example 3 - The signal is back within the limits, the previous exceed of the limit is indicated by the three red !!!. You can also still see the maximum level indicator out of the limits.