Harmonic FFT
The Dewesoft Harmonics display shows frequency components of the input signals. Harmonics analysis is similar to the FFT analysis, the main difference is the type of calculation and displaying: the harmonics display refers to a base frequency (e.g. 50 or 60 Hz) and displays its harmonics.

NOTE: Harmonics instrument on Design tool bar is available only in case of selection at least one power module in Dewesoft Setup -> Power analysis.
When you select Harmonics display in the design or run mode, following settings will appear on left part of the screen:
- Control properties - For detailed information about Harmonics display Control properties: grouping, number of column, Add / Remove, transparency,…see -> Control properties.
- Harmonics settings:
- Channels selector - For detailed information about assigning / reassigning channels to/from Harmonics display -> see -> Display settings.
Appearance on screen
The Harmonics displays show: base and harmonic frequencies, channel name(s), unit(s)…
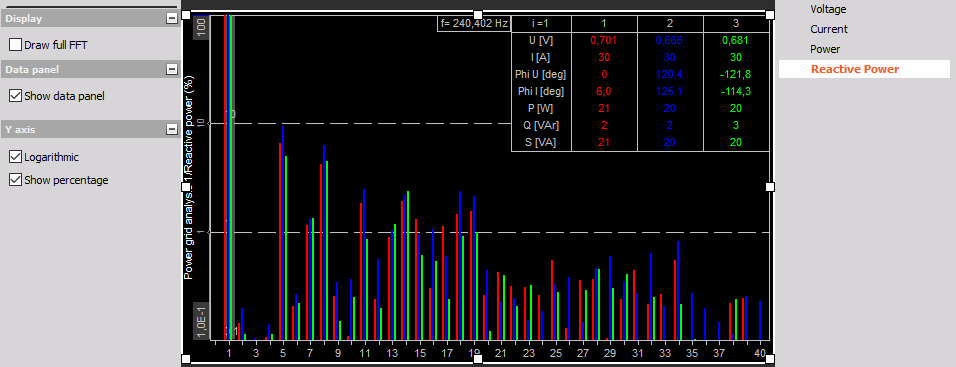
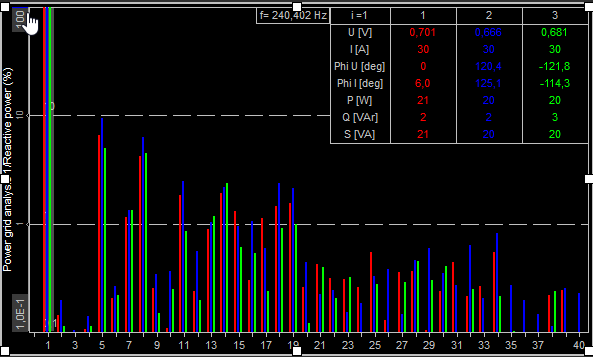
Harmonics display with Data panel and Logarithmic Y axis
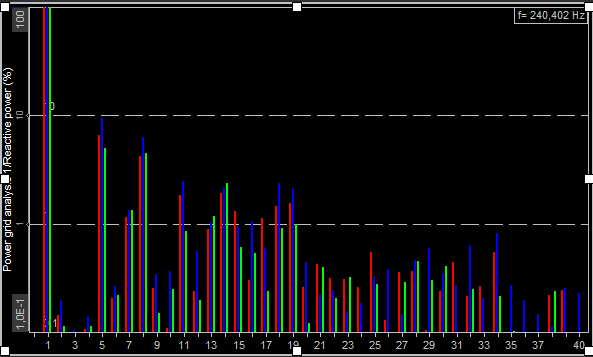
Harmonics display with Logarithmic Y axis
For detailed information about instruments positioning, size and transparency see -> Screen edit functions.
Display value
Dewesoft Harmonics display always shows all channels from one module at the same time. The Display value defines what the content should be from the channel selector on the right side:
- Voltage
- Current
- Power - active power
- Reactive power - this is wasted energy
- Line voltage

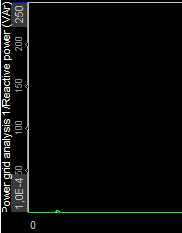
Draw full FFT
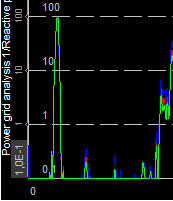
With check Draw full FFT check-box in Display value section instead harmonics bars full FFT spectrum can be displayed (see right).
Data panel
This function shows in addition to the bars also the most important measurement values for each phase: Ui, Ii, Phi, cos Phi, Pi, Qi and Si (where i is the number of the selected harmonic).
To display these values check the Show data panel check-box (example picture see above) in Data panel section.
To select a Harmonics, which values will be displayed in data panel, simply move the mouse cursor over the bars, a gray harmonics cursor (rectangle) will follow and indicates your selection.
When you want to fix your selection press the left mouse button (on example above 1st harmonic is selected). To select another harmonic move the mouse to its position and left-click again.
If you want to release the harmonics cursor move the mouse to its position and left-click again. Now the harmonics cursor is ‘free’ again.
NOTE: Harmonics cursor works only by checked Show data panel check-box.
Y axis display
In this part of Harmonics display settings you can choose with check /uncheck appropriate box different Y axis scaling:
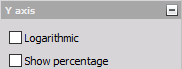
Logarithmic
Logarithmic check-box in Y axis section is:
- Selected -> logarithmic Y axis scaling
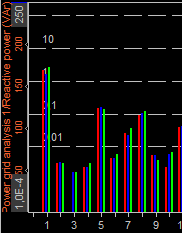
- Unselected -> linear Y axis scaling
Show percentage
Show percentage check-box in Y axis section is:
- Selected -> the Y axis is scaled in %
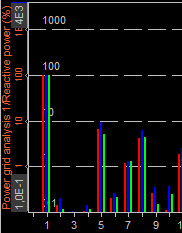
- Unselected -> the Y axis is scaled in it’s units (V, A, W or Var)