Octave preview
The Dewesoft Octave instrument is meant to display the frequency components of acquired signals in amplitude and frequency. The Octave preview widget performs FFT synthesized octave analysis. On Octave instrument only one channel can be displayed.

IMPORTANT: Octave analysis instruments provides basic options. For advanced CPB analysis, please add CPB math channel in the setup and use 2D graph to visualize the data.
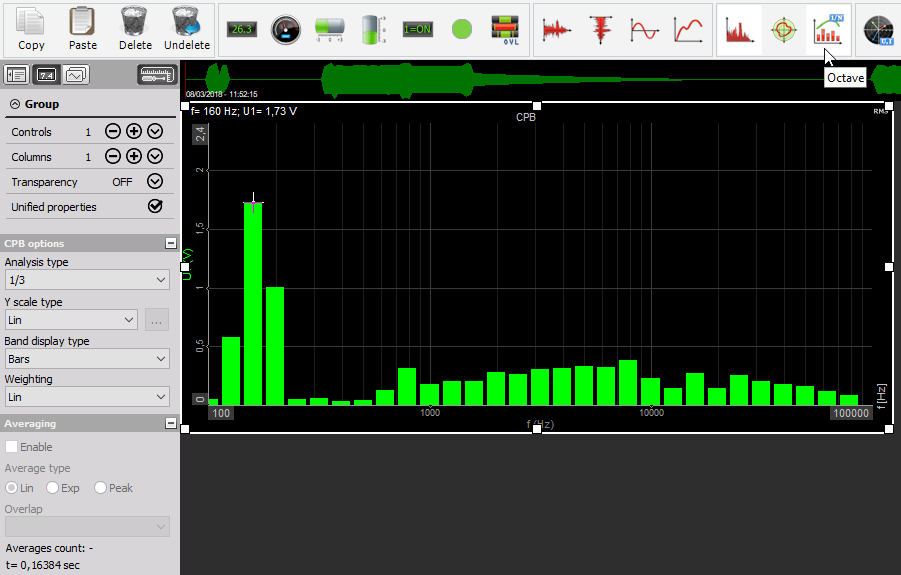
When you select Octave instrument in the design or run mode, following settings will appear on left part of the screen:
- Control properties - For detailed information about Octave instrument Control properties: grouping, number of columns, Add / Remove, transparency,…see -> Control properties.
- Octave settings
- Display settings - with Analysis type, Y scale type, Band display type and Weighting
- Averaging settings - Averaging type, Overlap and Averages number
Available appearance setting for Octave instrument in Run mode are:
- Y-axis scale/auto scale
- Online calculation
- Channels selector
For detailed information about assigning/reassigning channels to/from Octave -> see -> Display settings.
Appearance on screen
The Octave element offers all important information: channel name, unit, frequency information, calculation values…
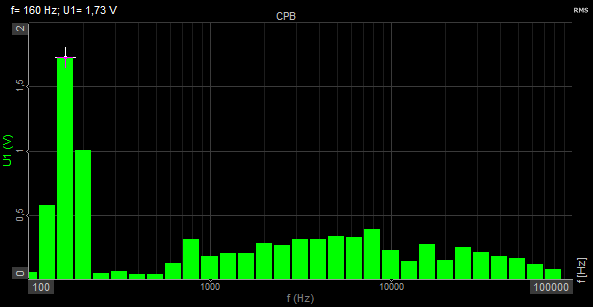
Bar Band display type
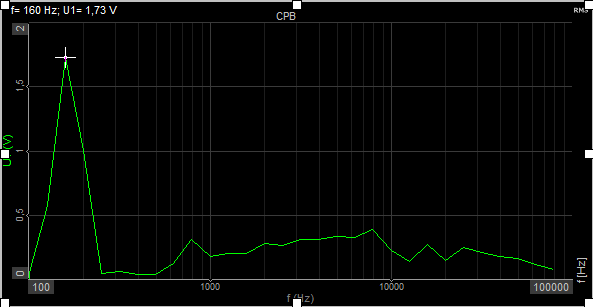
Lines Band display type
For detailed information about instruments positioning, size and transparency see -> Screen edit functions.
Online calculation
To keep an overview over the Octave, Dewesoft can calculate the RMS values displayed signals. To activate the calculation, just click on the RMS button to see the RMS values.


Octave display settings - CPB options
Serious Octave analysis requires several settings to get a useful result. All these settings Dewesoft combine the CPB options part. It contains:
- Analysis type
- Y scale type - For detailed information about Y scale type see -> FFT X and Y scale type —>FFT Analysis.
- Band display type
- Weighting - acoustic spectral weighting is done in the frequnecy domain. For information about weighting see -> FFT Weighting —> FFT Analysis.
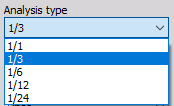
Analysis type
Dewesoft knows four different Analysis types for FFT analysis. The analysis type defines the width of each band.
The next band is calculated as 2^(AnalysisType) from the previous band, so for 1/1 this is 2^(1/1)=2, for 1/3 analysis this is 2^(1/3)=1,26 and so on.
For 1/3 spectrum, there will be 10 bands per decade, for 1/12 there will be 40 and for 1/24 there are 80 values.
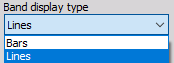
Band display type
Dewesoft supports two display types which can be selected from drop Band display type down list according to your application:
- Bars
- Lines
For information about this display types -> see Appearance on screen (above).
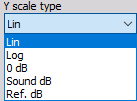
Y scale type
Dewesoft allows:
- four Y (amplitudes) axis scaling types (Linear, Logarithmic, 0 dB and Noise dB and Ref. dB scaled). Select the axis type from the drop-down list according to your application.
Octave Averaging settings
Use averaging mode to get a more stable Octave display.
To activate the averaging just click the Enable check-box on Averaging section and all control become available.
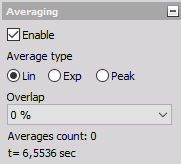
When Exponential averaging is selected true octave band time filters are used instead of FFT synthesized fitlers.
For detailed information about Averaging settings see -> FFT Averaging.