Polar plot
The Polar Plot widget is one of the main widgets used when performing orbit analysis by using the Orbit Analysis application module in DEWESoftX.
The motion of rotating shafts running through journal bearings are of great importance to monitor and investigate both while in operation and when doing post analysis. The Polar plot widget, together with the Orbit plot and Orbit waveform widgets, are designed specifically for this purpose - making it possible to visualize all relevant indicators required for such investigation and diagnostics assignments.
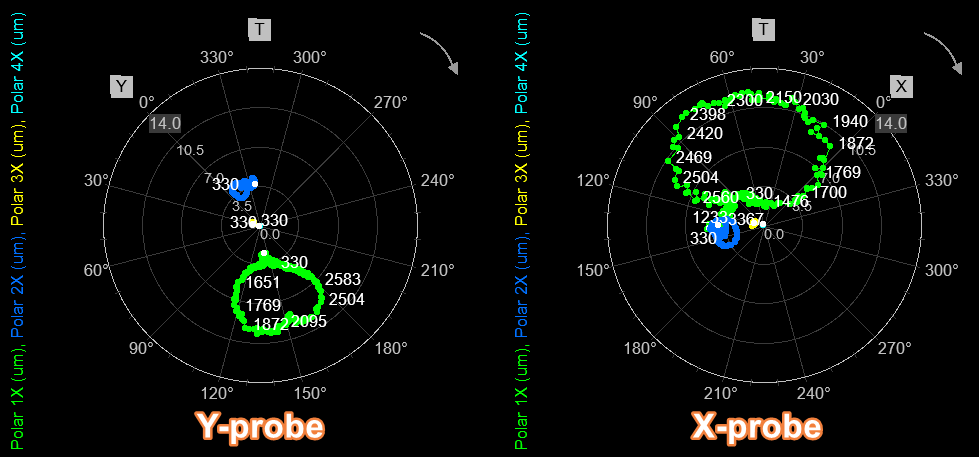
An example of measured data visualized in Polar plot widgets are shown above, where a Polar plot widget is added for each of the two bearing probe sensors. Harmonic 1 to 4X have been set-up to be extracted from the Orbit Analysis application module. These extracted harmonic channels are selected on the Polar plots.
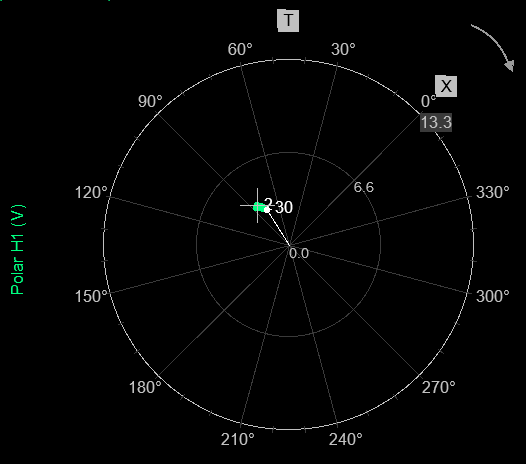
In the Polar plot widget, depending on the selected Polar channel, either X and Y marks the angle position of the related proximity probe, whereas T marks the tacho’s position. Rotation direction is also shown on the graph with an arrow.
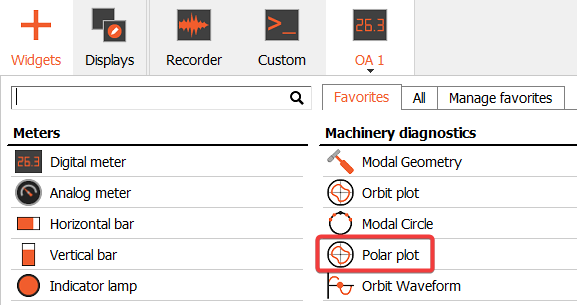
The Polar plot widget is part of the pre-defined display template for the Orbit Analysis module, but can also be added to a custom made display by selecting it under the Widgets menu, found under the Machinery diagnostics section.
Drawing options
The Polar plot widget has a list of parameters that defines how the polar data will be visualized.
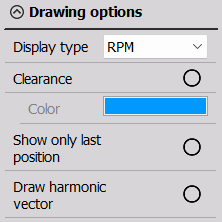
Display type
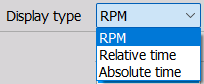
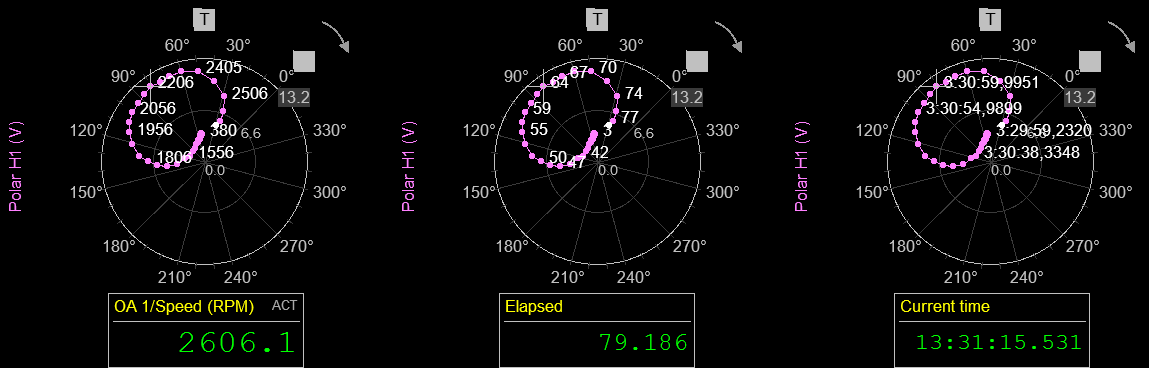
The Display type determines what information is labeled on the points in the Polar plot widget.
RPM - plotted polar values are labeled with RPM values
Relative time - plotted polar values are labeled with relative time values
Absolute time - plotted polar values are labeled with absolute time values
Clearance
![]()
If a Clearance circle or ellipse has been defined for a bearing in the Orbit Analysis application module, then this can be shown on the Polar plot as illustrated below:
![]()
The clearance color can be user-defined.
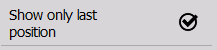
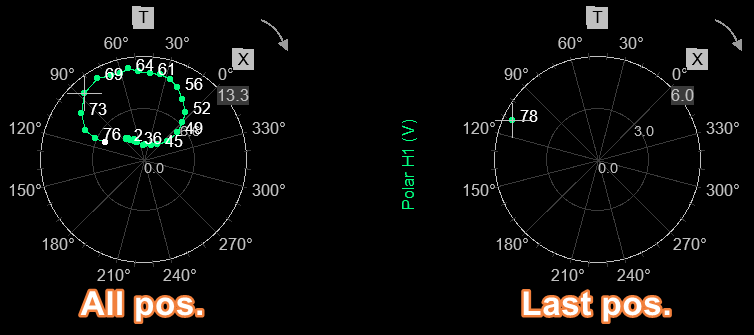
Show only last position
When having multiple polar values plotted over time, then it can be determined if the plot should ‘Show only last position’ of the polar magnitude and phase or all positions. The difference is illustrated below:
Draw harmonic vector
In order to track the probe sensor’s current magnitude and phase position in the Polar plot widget, ‘Draw harmonic vector’ can be enabled. Hereby a white straight line will be shown from the center of the Polar plot and out to the current polar data position. This line sometimes also helps reading the phase angle easier.