Orbit Waveform Graph
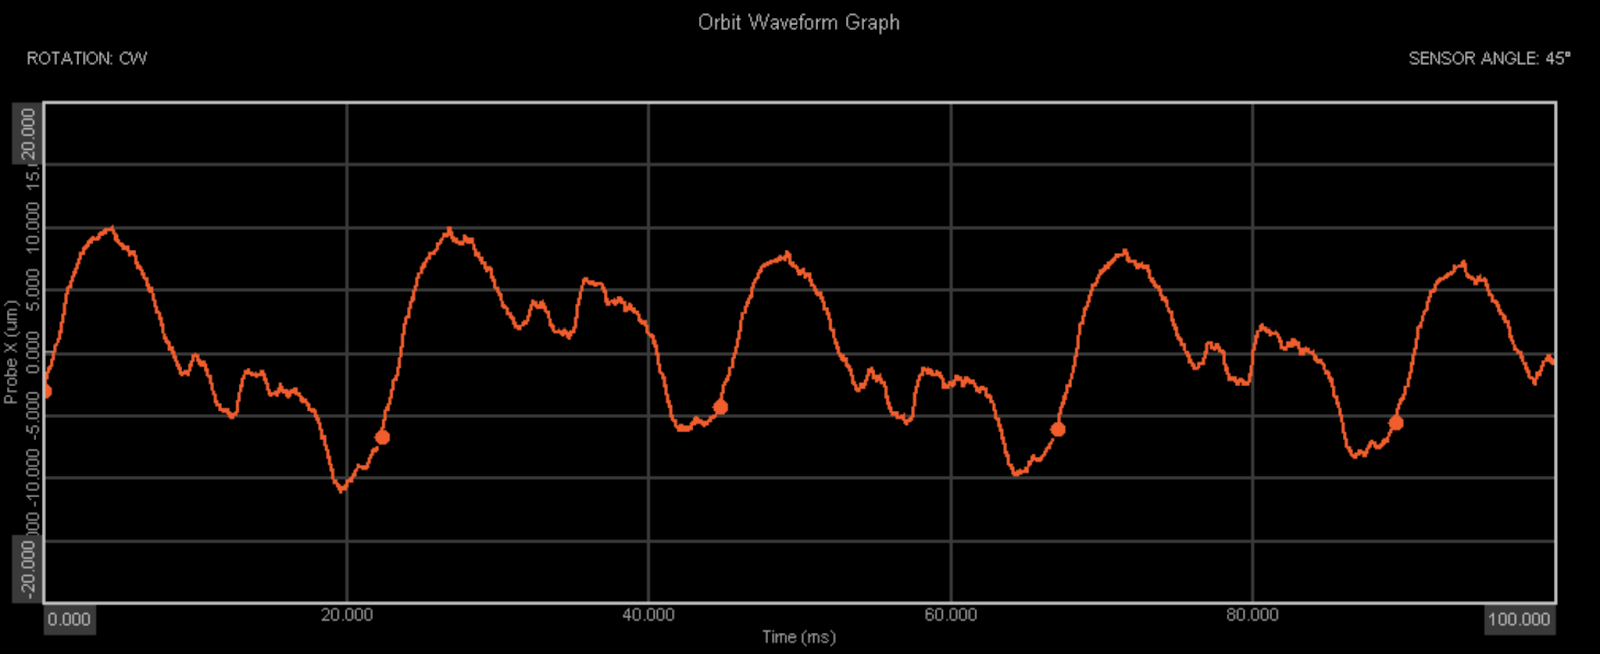
The Dewesoft Orbit Waveform Graph presents time domain data from each of the sensors used within a constant timespan, along with a clear indication of the zero pulses, allowing the user to observe the start and stop of each period.
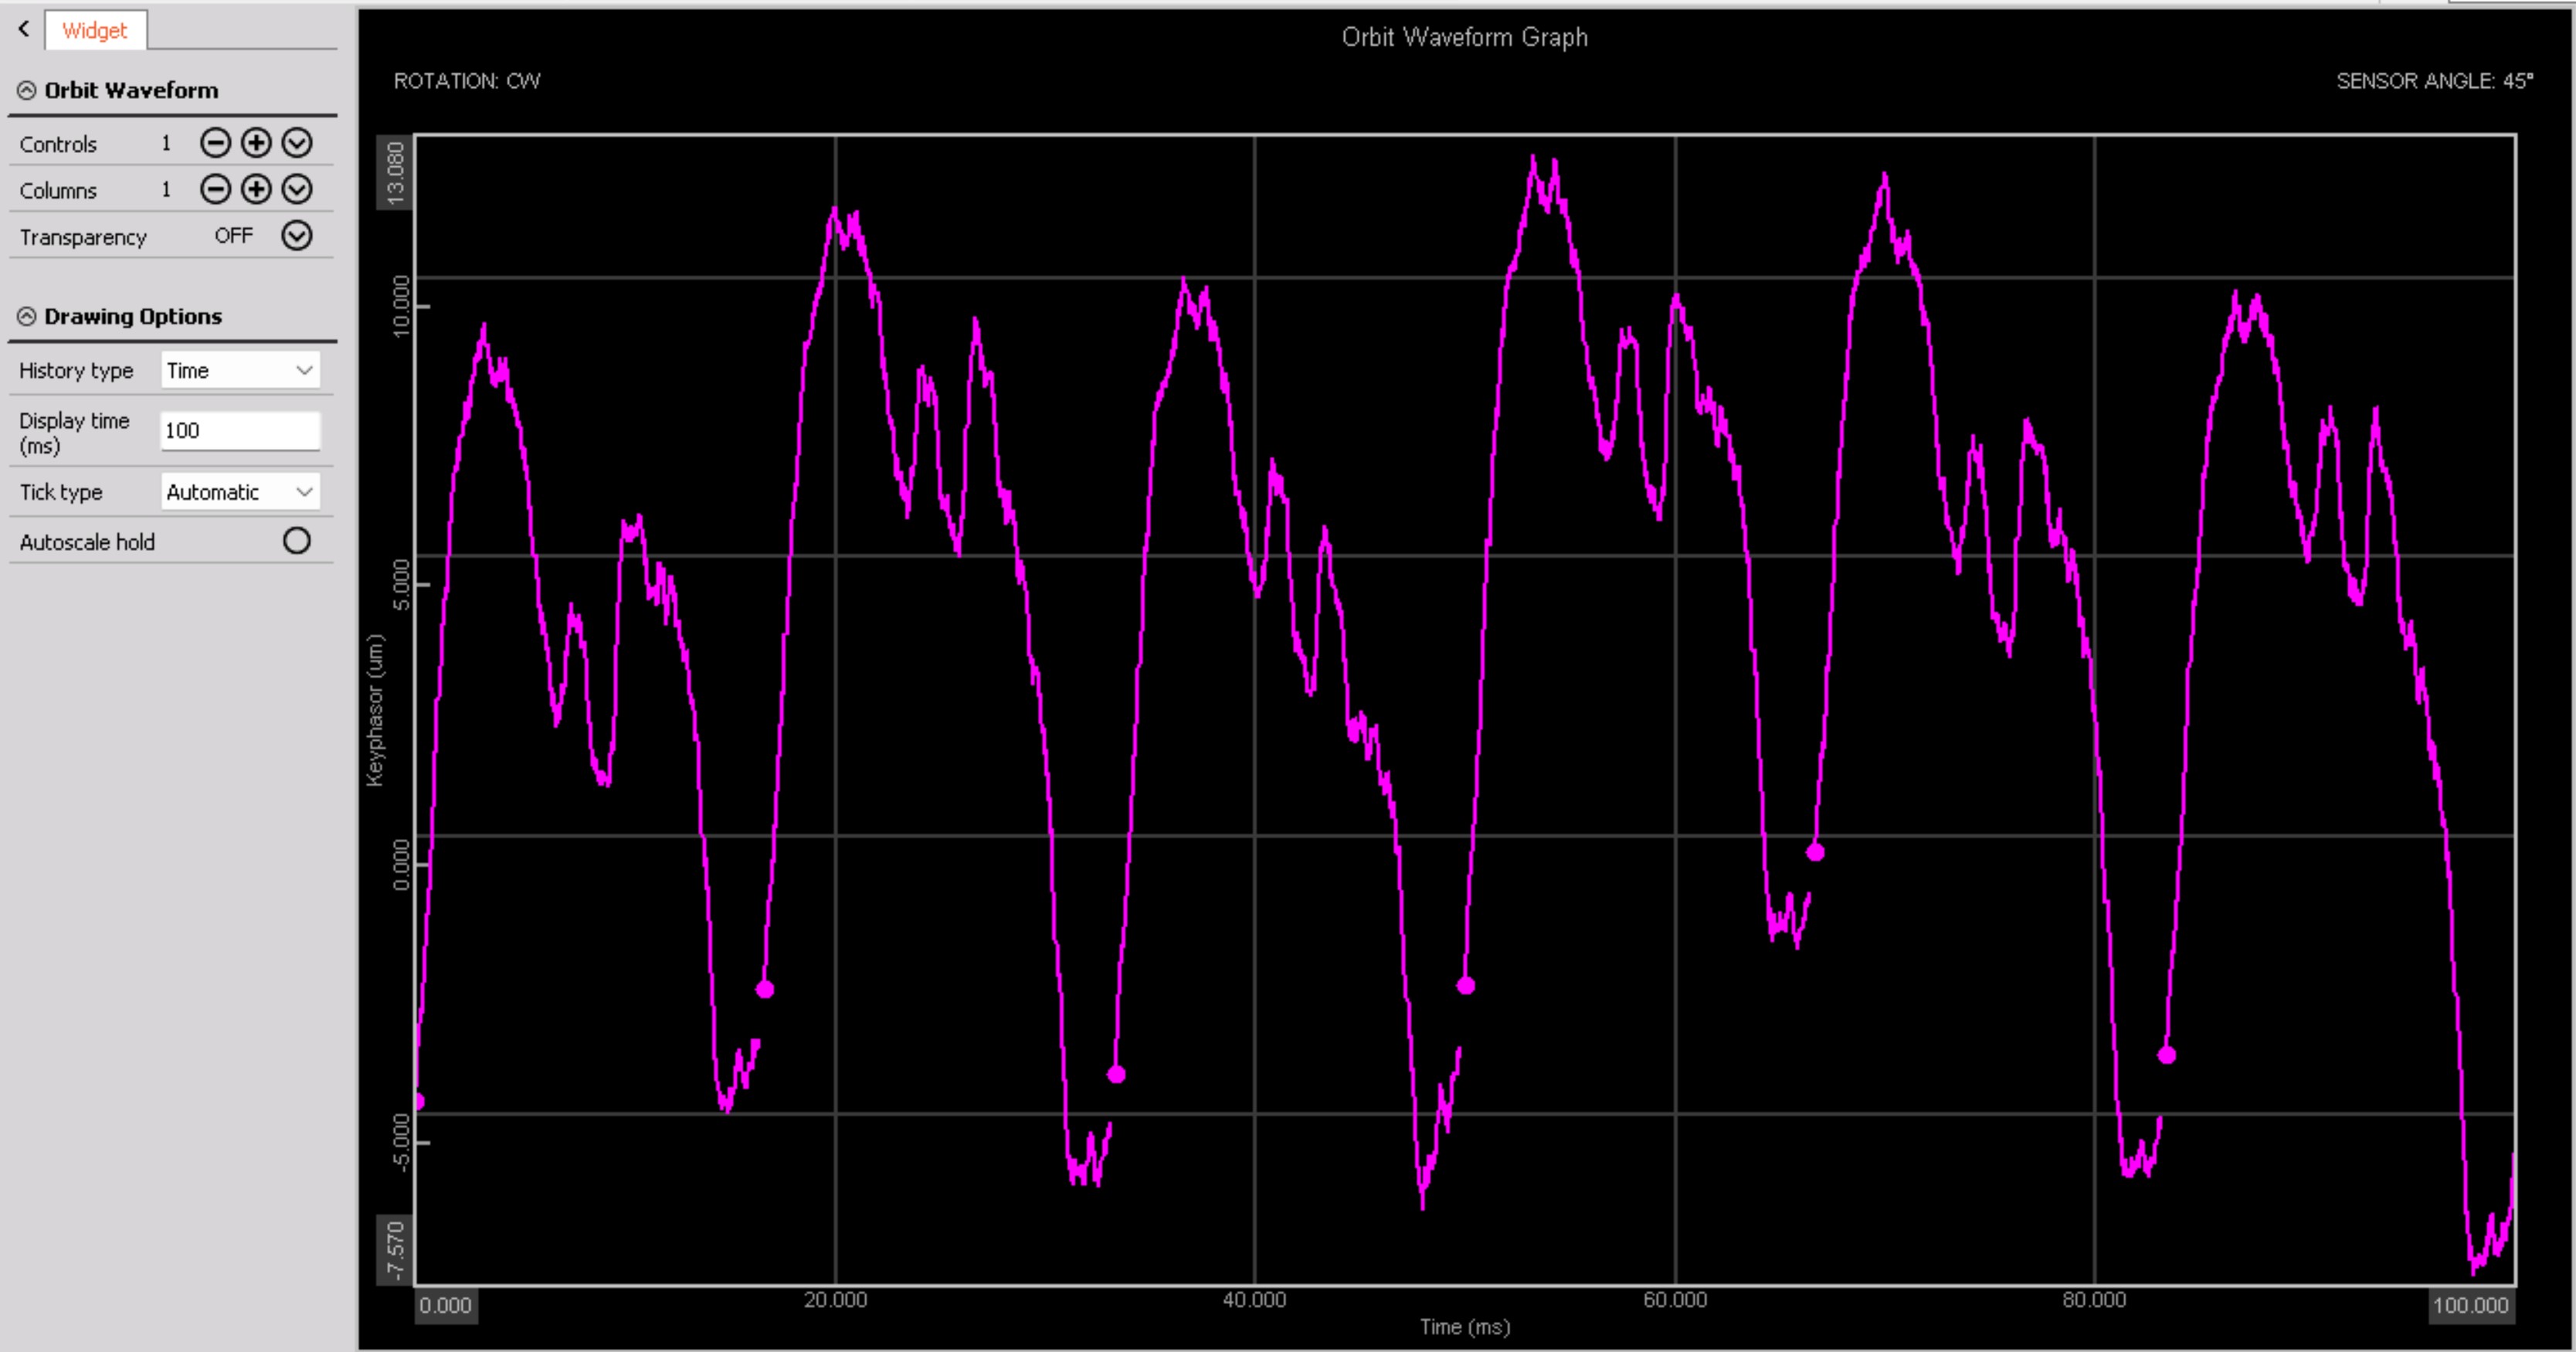
Together with the Orbit plot and the Polar plot widgets, the Orbit Waveform Graph is a dedicated visual control for use with the Orbit Analysis application module. The Orbit waveform graph should be used to visualize related time waveform output channels from the Orbit analysis module. Upon addding the Orbit Waveform, the left side settings tab will appear as shown below:
Orbit Waveform - control properties
For detailed information about Control properties: grouping, number of column, Add / Remove, transparency visit the Instrument appearance section of this manual.
Drawing options
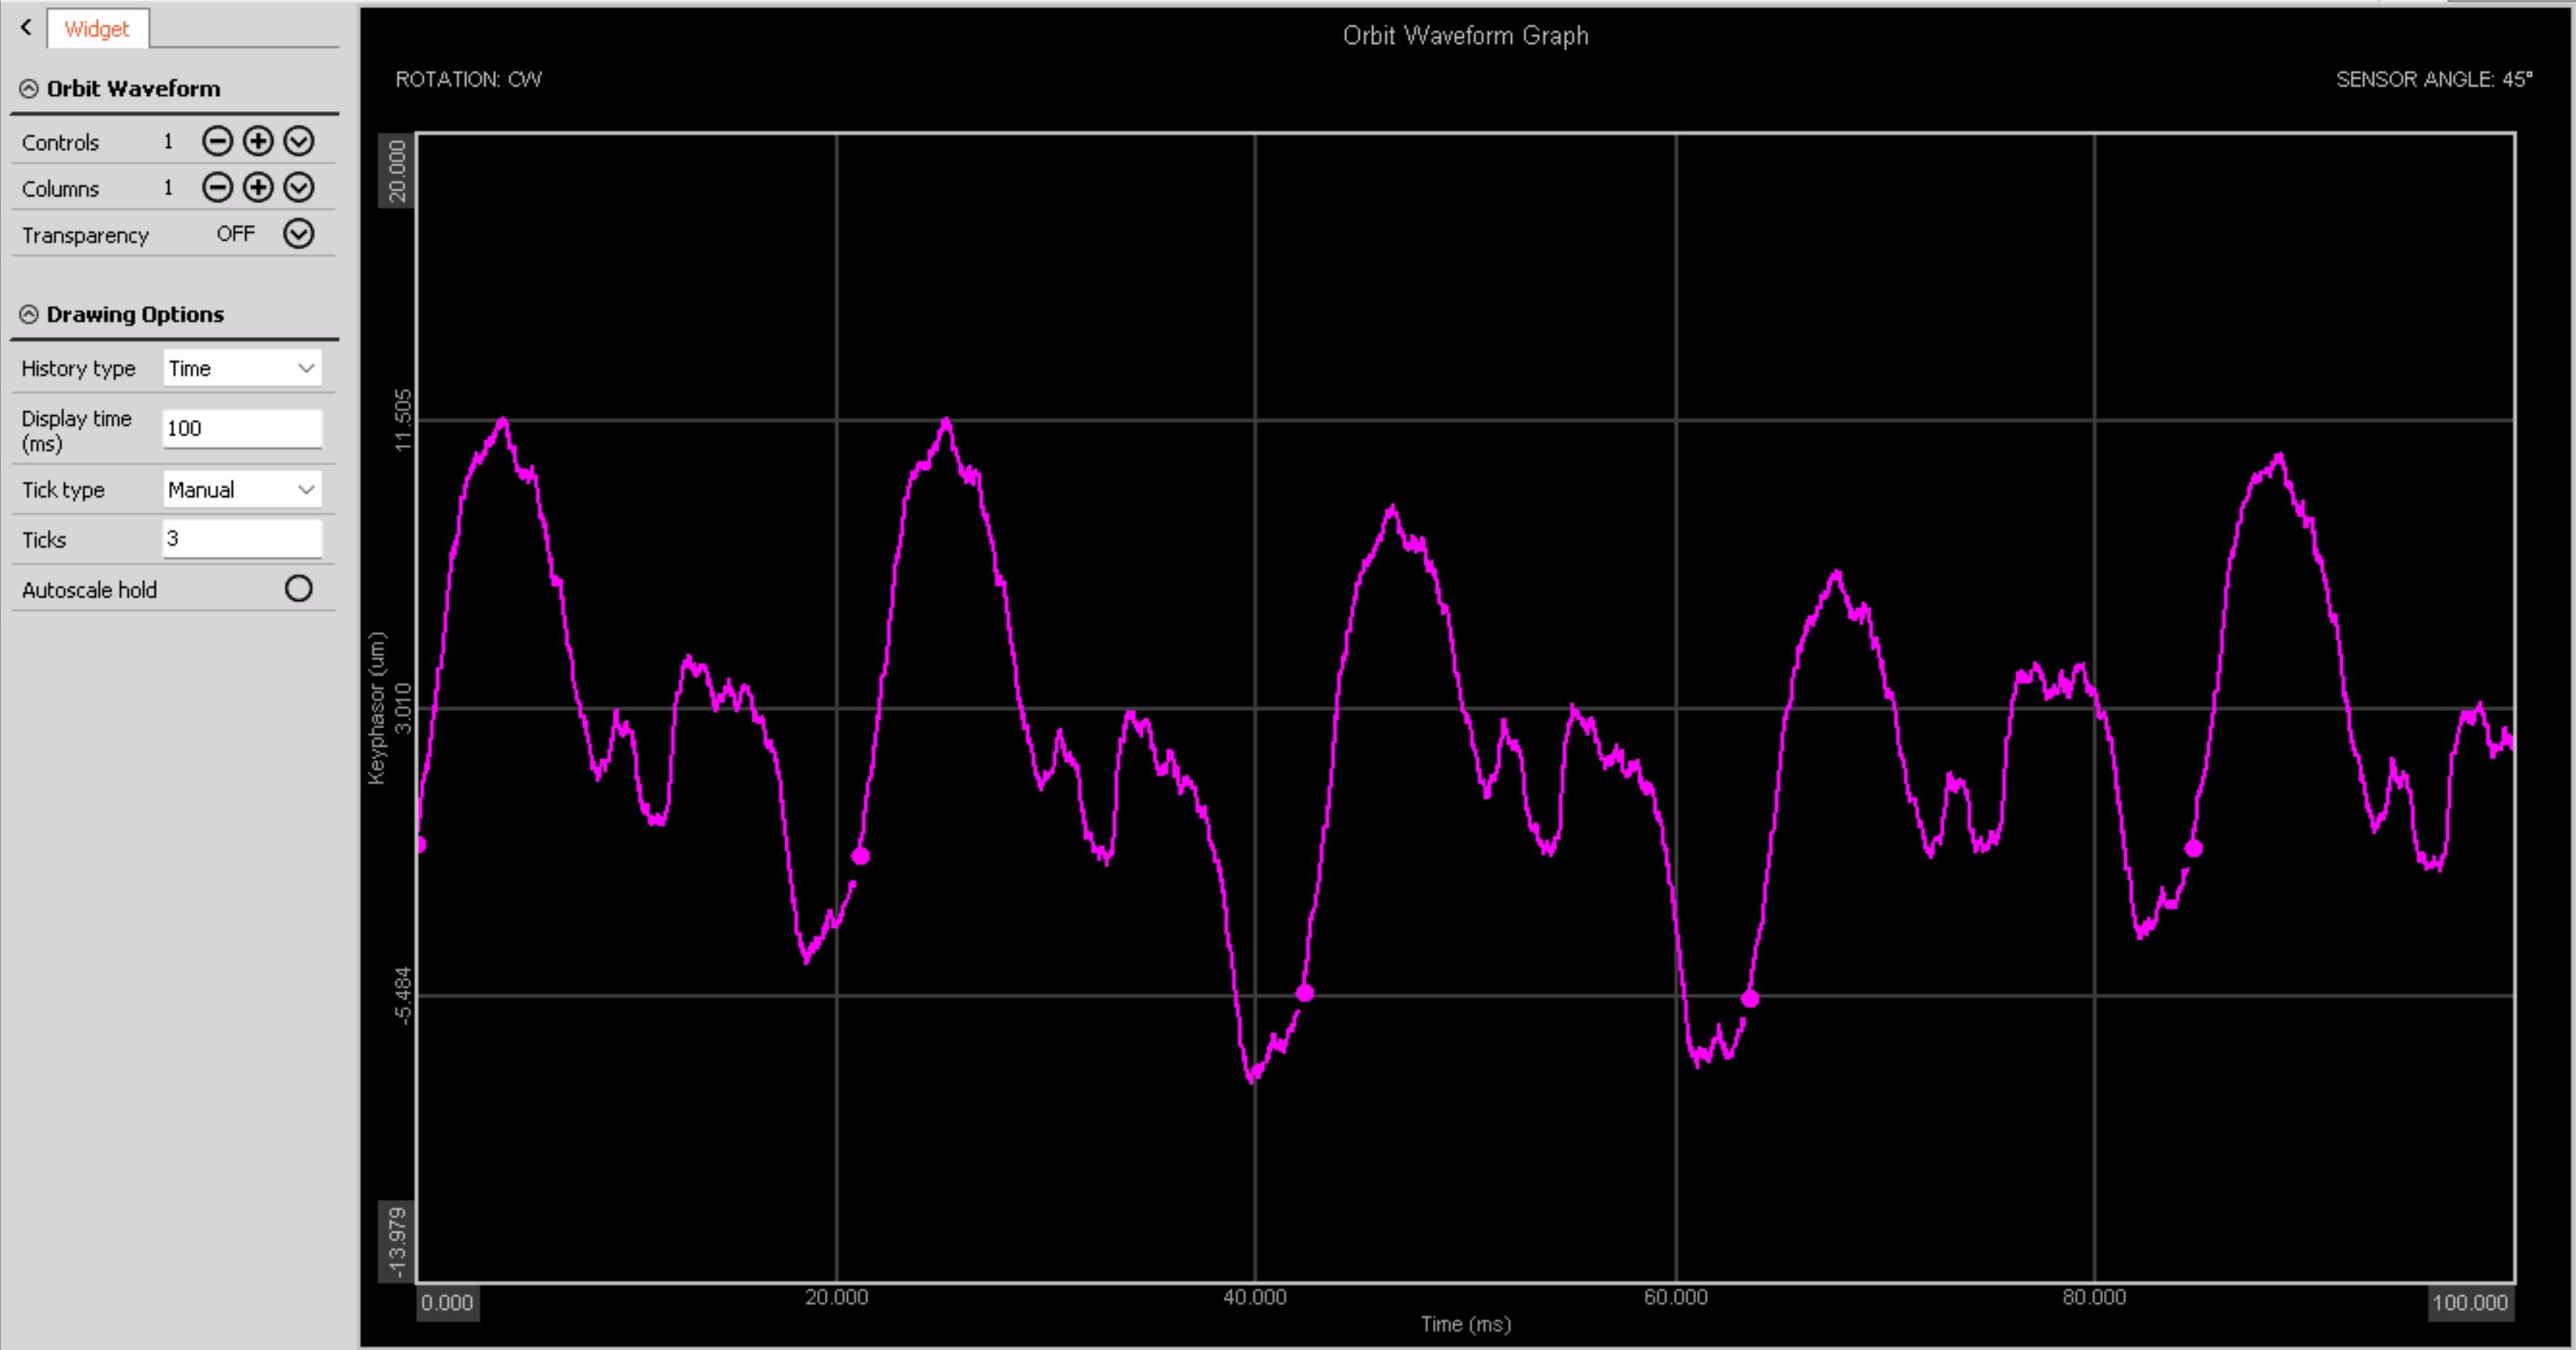
This section of the settings tab toggles options of how data is shown on the graph, with the following options available: * History Type: The user selects data span to be defined in Revolutions or Time * Revolutions/Time: depending on the selection in the above dropdown (History type), this input field allows the user to input the desired time span or number of revolutions to be displayed on the Orbit Waveform Graph * Revolutions display mode: when Revolutions is selected as the History type, this dropdown will appear and the user can select the desired quantity to be shown on the X axis: Revolution count, Angle or Time are available * Tick type: user selects between Automatic or Manual Tick definition. If Manual is selected, the number of field is specified through a dedicated Number of Ticks input field that appears as shown below:
Scaling of the Orbit Waveform Graph
As the Orbit Waveform Graph represents time data, the scale and autoscale behavior are aligned with the Recorder widget:
- Left click on Y axis: scales the Y axis once, according to the min and max of the curent data shown in the widget
- Right click on Y axis: scales the Y axis to the min max values as defined for the analog channel that the probe is connected to
- Autoscale checkbox: this option switches on the continuous scaling according to the min max of the current data span shown
Color of the Orbit Waveform Graph
As there is a direct 1 to 1connection between the input and Orbit Waveform Graph, there will be one waveform output per each of the probe’s used in your machine train. The rule for color is that the input color is followed, meaning, the waveform output will be the same color as set for the analog input that the probe is connected to. In order to change the color of the waveform, user navigates to Ch. setup and Analog in, then changes the color of the corresponding input.
Left side settings tab
As with any other widget, within the left side tab you will find the channel selector. Additional info can be found in the Channel selector section of this manual.