Orbit Plot
The Orbit plot widget is one of the main widgets used when performing orbit analysis by using the Orbit Analysis application module in DEWESoftX.
The motion of rotating shafts running through journal bearings are of great importance to monitor and investigate both while in operation and when doing post analysis. The Orbit plot widget, together with the Polar plot and Orbit waveform widgets, are designed specifically for this purpose - making it possible to visualize all relevant indicators required for such investigation and diagnostics assignments.
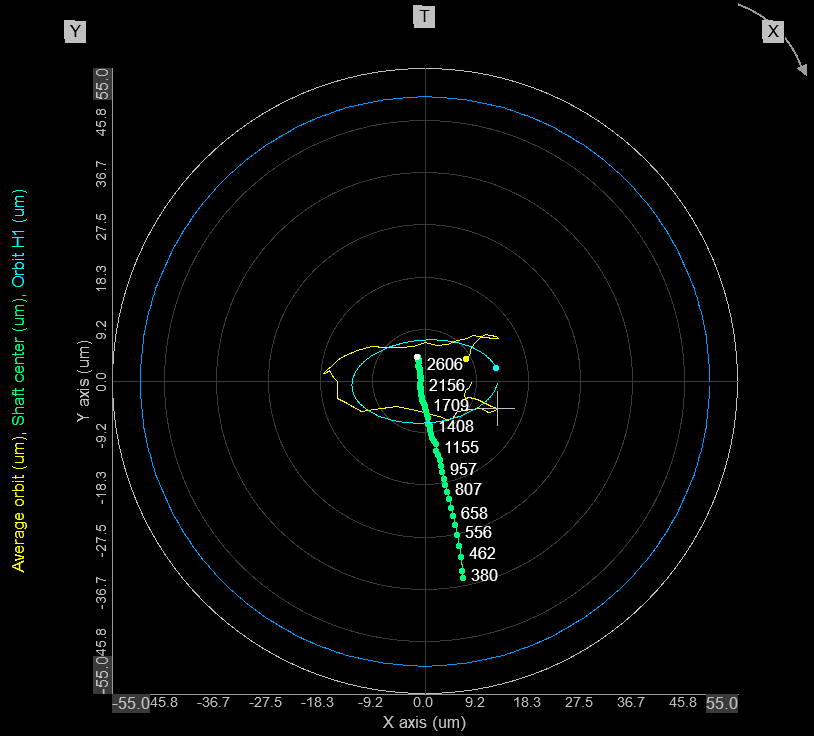
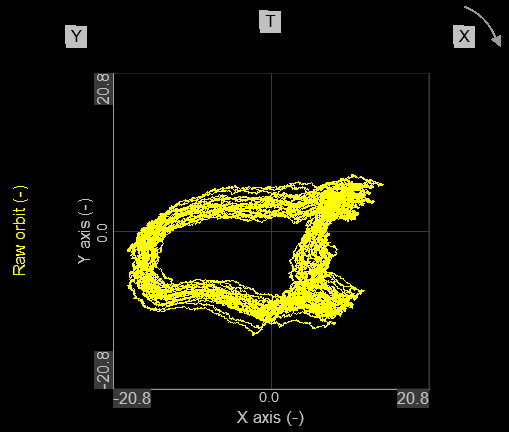
In the Orbit plot example above three channels are overlaid:
- Average orbit
- Orbit 1X (1st harmonic)
- Shaft center
The X and Y mark the angle position of proximity probes, whereas T marks the tacho’s position. Rotation direction is also shown on the graph with an arrow.
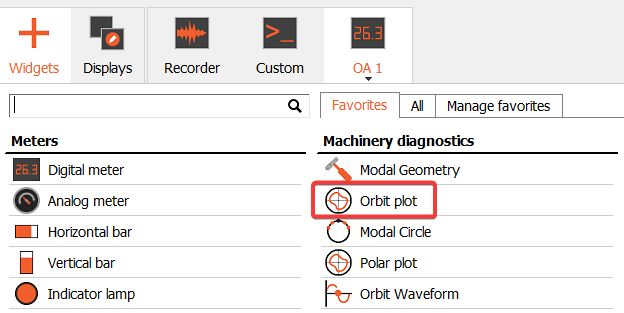
The Orbit plot widget is part of the pre-defined display template for the Orbit Analysis module, but can also be added to a custom made display by selecting it under the Widgets menu, found under the Machinery diagnostics section.
Supported channels to plot
The Orbit Plot widget supports data visualization of the following channel function types:
- Orbit[X]X
- Shaft center
- Averaged orbit
- Bearing [X] Raw orbit
- Reference orbit
- Sub-synchronous orbit
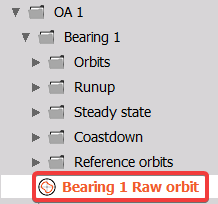
NOTE: To plot the Raw Orbit the Raw orbit group channel must be selected in the channel list under the Bearing folder, and not the Raw orbit channel under the Orbits folder.
The supported channel types listed above are provided by the Orbit Analysis application module. The full list of output function types from the Orbit Analysis module can be found here: Orbit Analysis module output list
Drawing options
The Orbit plot widget has a list of parameters that defines how orbit related data will be visualized.
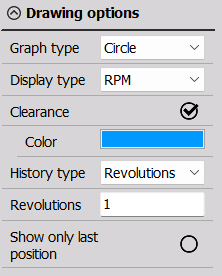
Illustrations with different set Drawing option will be shown the later sections, but below the parameters are listed with descriptions:
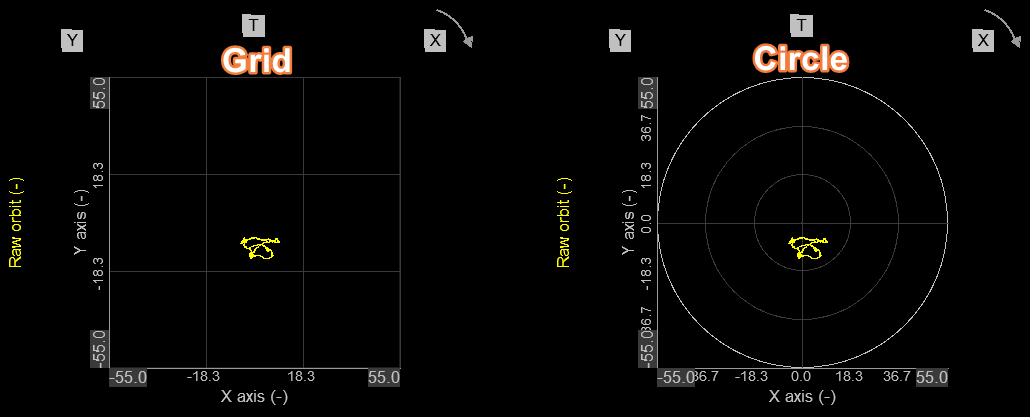
Graph type
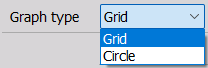
The Graph type plot area can be defined as a rectangular Grid or as a Circle.
Grid - the widget has two perpendicular cartesian axes X (horisantical) and Y (vertical).
Circle - the widget has one cylindrical radius axis, and hereby changing X will also change Y.
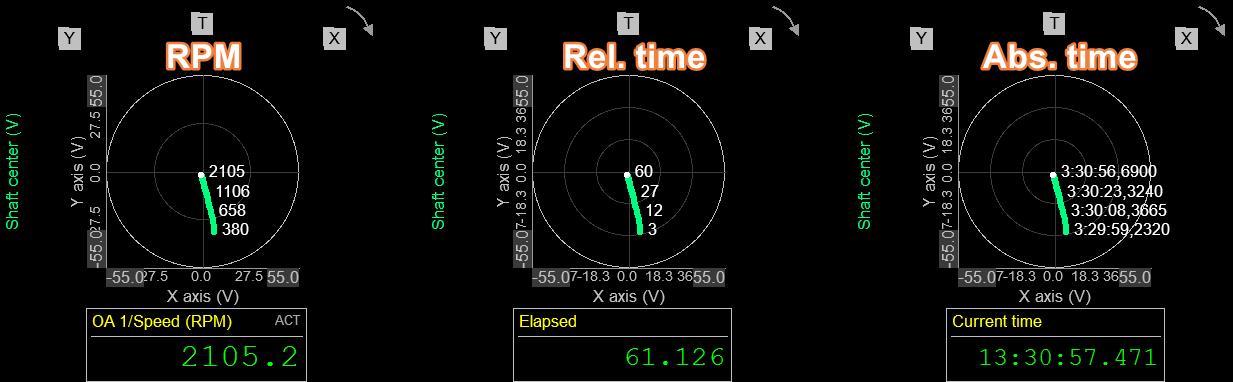
Display type
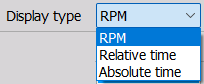
The Display type is used when Shaft center channels are added to an Orbit plot widget.
RPM - plotted shaft center locations are labeled with RPM values
Relative time - plotted shaft center locations are labeled with relative time values
Absolute time - plotted shaft center locations are labeled with absolute time values
Clearance
![]()
If a Clearance circle or ellipse has been defined for a bearing in the Orbit Analysis application module, then this can be shown on the Orbit plot as illustrated below:
![]()
The clearance color can be user-defined.
History type
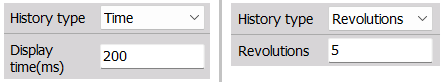
The History type is used when Raw orbit channels are added to an Orbit plot widget.
Revolutions - the visible data duration is defined in number of shaft rotations
Time - the visible data duration is defined in number of milliseconds.
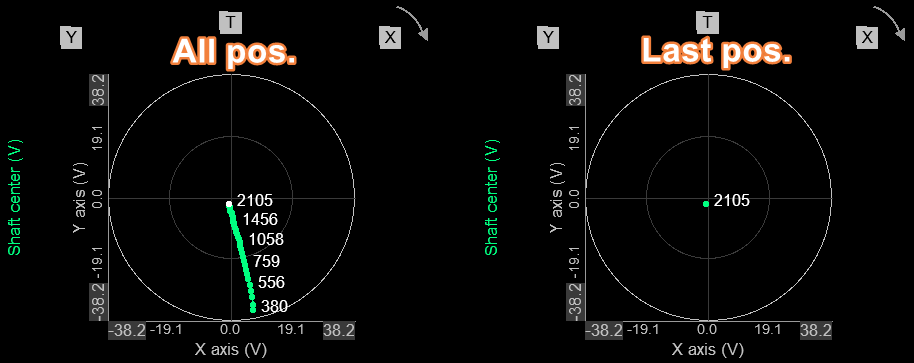
Show only last position
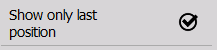
When Shaft center channels are added to an Orbit plot widget, then it can be determined if the plot should ‘Show only last position’ of the shaft center or all positions. The difference is illustrated below:
Raw orbit with clearance circle and Shaft centerline
While having a machine running and monitoring the Raw orbit it can be important to inspect the shaft movement and center position together with a defined clearance area, in order to determine the state of the shaft displacement better.
Below is an illustration of a Raw orbit channel plotted together with a clearance circle and the related shaft center channel:
![]()
NOTE: The clearance is defined in the Orbit Analysis application module under each Bearing setup section.
Average orbit and Raw orbit comparison
This representation is created by assigning an Average orbit channel and a Raw orbit channel group to the Orbit plot widget. The Average orbit was defined in the Orbit Analysis application module to average across 12 revolutions:
Depending on the use case decision, alarms, and triggers might be based on the Raw orbit, the Average orbit or a combination of both.
nX Orbit / Filtered orbit
Depending on the list of harmonics to be extracted, there will be a harmonic orbit available for each order as indicated in the Orbit Analysis module output list. The movement of the individual harmonics can be shown directly on the Orbit plot.
The above Orbit plot widget shows an example of filtered orbits in blue and green. The particular orbits shown are: 1X (Blue) and 2X (Green).
Detection of specific critical phenomena might be linked directly to certain harmonic components. In such cases those certain harmonics can be monitored individually in the Orbit plot widget.
In addition, the widget can illustrate Subsynchronous/subharmonic orbits in the same way as the harmonic ones.