Campbell Plot

The DewesoftX Campbell plot (or diagram) is designed to make analysis easier and improve data visualization, especially for rotational machinery testing. With it, you can visualize 3D values on a single plane and it is mostly used in Order tracking. It can be applied to both the FFT waterfall vs. RPM and Order waterfall vs. RPM from the Order Tracking module.
NOTE: For interactive training, please refer to the following Dewesoft Online Training lessons:
Features
NOTE: The redesigned Campbell plot widget and its features decribed here are available in DewesoftX 2026.2 and onwards. Please visit our Downloads page for the latest version of DewesoftX.
You can assign multiple channels to one Campbell plot widget for quick and easy comparison. If viewing a single channel, a color gradient (e.g. blue to red) can still be used to represent increasing amplitude.
For better visualization, you can use cross-shaped markers - their vertical size will be scaled to the signal’s amplitude. For even better control, you can define cut off values, represented on the Y axis by a triangle marker. A new order traceline grid makes order tracking easier.
These features of the advanced triple Campbell plot are especially useful for demanding applications, such as jet engine testing.
Settings
After selecting a Campbell plot widget, you will see the following settings in the Widget tab on the left:
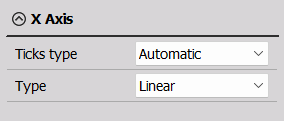
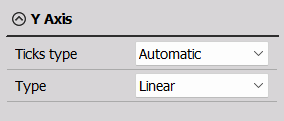
X and Y Axes
The settings for these two axes are identical, but independent from each other. You can change the:
- Ticks type - Automatic, Steps, Divisions
- Type - Linear, Log
Z Axis
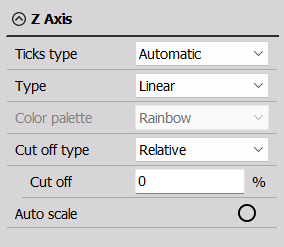
- Ticks type - Automatic, Steps, Divisions
- Type - Linear, Log, 0 dB, Sound dB, Ref. dB
- Color palette
- Cut off type - Relative, Absolute
- Cut off
- Auto scale
Display Options
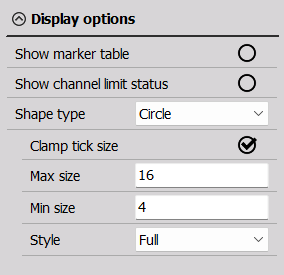
- Show marker table
- Show channel limit status
- Shape type - you can change from Circle to Vertical ticks via this dropdown menu.
- Clamp tick size
- Max/Min size
- Thickness
Projection
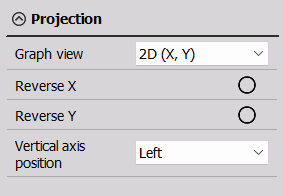
In this section, you can customize:
- Graph view
- Reverse X,Y
- Vertical axis position
Channel Selector
To the right of the display, you will find the Channel selector.
If using multiple channels, each one will have its own color and the legend at the top of the widget will show you which color is assigned to which channel.