XY recorder
The XY recorder is designed to display channels versus channels; there is no direct time relation.

When you select XY recorder instrument in the design or run mode, following settings will appear on left part of the screen:
Control properties
For detailed information about XY recorder Control properties: grouping, number of column, Add / Remove, transparency,…see -> Control properties.
XY recorder settings
Typical XY recorder setting in Setup tab are:
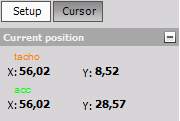
Y channels cursor readouts are displayed in Cursor tab.
Available appearance setting for XY recorder instrument in Run mode are:
- X-axis scale/auto scale - logical same as for Vertical recorder
- Y-axis scale/auto scale - common instruments tools
- Channels selector
For detailed information about assigning / reassigning channels to/from XY recorder -> see -> Display settings.
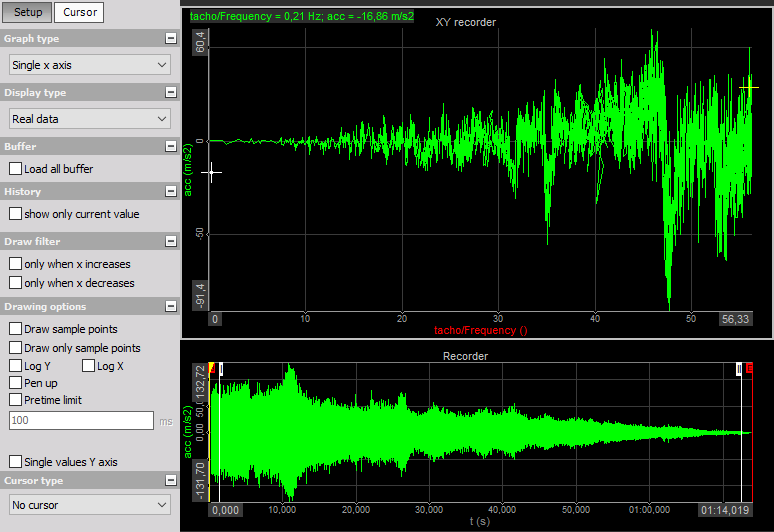
Appearance on screen
NOTE: The only difference to time-based displays is that the first selected channel is always used as the X-axis channel.
The XY recorder element can display up to sixteen Y-axis channels, related to one other channel on the X-axis at the same time (in single-y mode the logic is reversed)
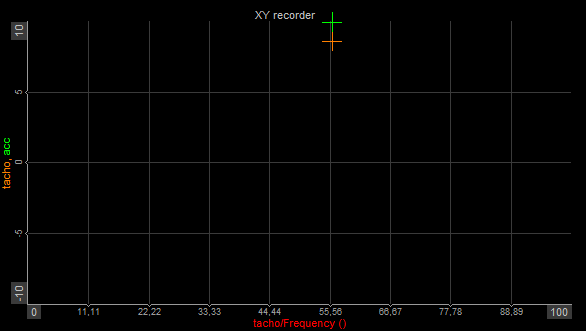
The yellow cross indicates the latest displayed value.
XY recorder appearance with only current value see -> History (below).
For detailed information about instruments positioning, size and transparency see -> Control properties.
Graph type
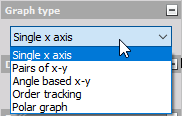
The Graph type knows four modes:
- Single x-axis - Allows only one channel on the x-axis. The first assigned channel is assigned to the x-axis, the following channels are assigned to y-axis (up to 16).
- Pairs of xy - Allow defining multiple ‘sets’ of xy channels. First select the channel for x-axis, then select channel for the y-axis. This function allows referring different channels to different x-axis. Be aware that you still have only one x- and y-scaling! For example: x = distance 1, y = pressure 1. Now do the same for the second set, e.g. x = distance 2, y = pressure 2.
- Angle based xy - The first x axis channel is the reference channel of the angle. It should go from 0 to 360°. The second (and further channels) are angle related data (like rotational vibration - XY recorder now displays the rotational angle of current revolution). This XY recorder is like a scope, but with angle reference instead of time reference.
- Polar graph - In a polar coordinate grid will be a series of circles extending out from the pole and many different lines passing through the pole to represent the angles at which the exact values are known for the trigonometric functions.
- Single y-axis - Allows only one channel on the y-axis. The first assigned channel is assigned to the y-axis, the following channels are assigned to x-axis (up to 16).
Display type
Dewesoft XY graph is now being able to display the Real data. You can display also Average (for slow signals) or RMS values (for dynamic signals). As a standard, the values for the display type will be calculated over a period of 0.1 seconds.

Select any graph by clicking on it, and then select this value from the Display type drop-down list.
WARNING: Be aware that all Average and RMS display types represent only statistic values for the online display. The settings have no influence on the other displays or the data storage.
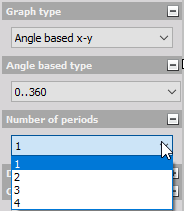
Angle based xy graph - The Display type for this Graph type is different as for other Graph types. You can display signals over a 1 period or 2, 3 or 4 periods which can be selected from the drop-down list.
X and Y scale divisions
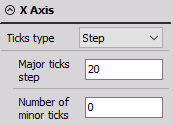
The XY recorder offers X and Y scale step/divisions. You can select the step or divisions and define the number of Major ticks step and the Number of minor sticks or X,Y scale divisions from one to twenty (= dashed white line which divides graph area), which can differ between X and Y axis.

The Single value axis check-box can be used to set all active channels of an XY recorder grid to only one Y-axis. If set, all channels will use the same scaling and as a visual result, there will be only one axis with values left. This function is very helpful when there is only small space for channel names and scaling and the channels use the same scaling.

Time scale
Recorder or scope displays show their content only for a limited time. But what about the XY graph? How long should it display data? Decide it by yourself. Simply click on the Reset view button in Time scale section to clear the graph.

Drawing options
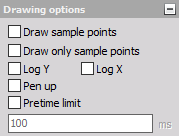
Dewesoft allows Log Y and/or Log X (logarithmic) axis types. Select the axis type (with checking appropriate box) according to your application.
For detailed information and using hints about X and Y scale type -> see -> Fast Fourier transform.
Auto Scale Axis
The XY recorder has the option to auto scale the axis. Since the operation is CPU intensive this option is disabled by default. The auto scale axis option can be enabled under Options -> Settings -> Advanced -> Visuals -> XY Graph
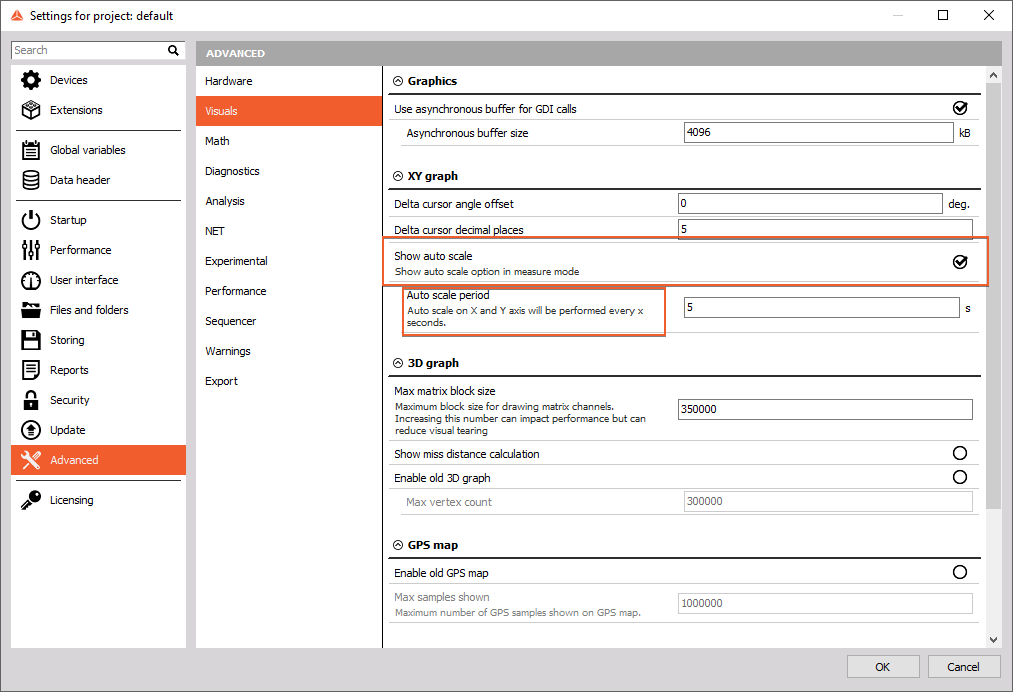
The auto axis option can then be turned on under the Drawing options:

Draw filter
Especially for run-up tests you should use the Only when x increases check-box in Draw filter section. This is only a drawing filter and avoids any values displayed which become smaller than before. Unselect this feature to receive also decreasing X-axis signals again.

History
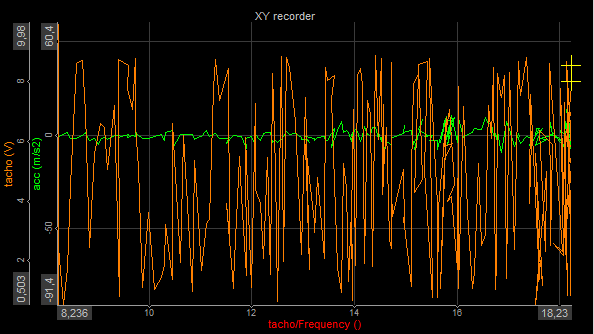
When the signal is changing very strong, it may be helpful to click the Show only current value check-box in History section; this removes all displayed values from the XY graph and shows only the current value. Unselect this feature to receive the whole signal history again.

Example: appearance XY recorder with enabled show only current value
XY Recorder Cursor
By selected Cursor tab the cursor readouts for each Y channel in CURRENT POSITION section is displayed.
