2D map
The GPS display is provided by Dewesoft to show different acquired data from GPS position and heading information. Different data can be calculated from the GPS channels.

NOTE: GPS display possibility on Design tool bar is available only in case of physical connection and set up of GPS in Dewesoft Setup -> GPS.
When you select GPS display in the design or run mode, following settings will appear on left part of the screen:
- Control properties - For detailed information about GPS display Control properties: grouping, number of column, Add / Remove, transparency,… see -> Control properties.
- GPS settings
Typical setting for GPS instrument are divided in three modes:
- View
- Coloring
- Calibrate map
- Channels selector - For detailed information about assigning / reassigning channels to/from GPS display -> see -> Display settings.
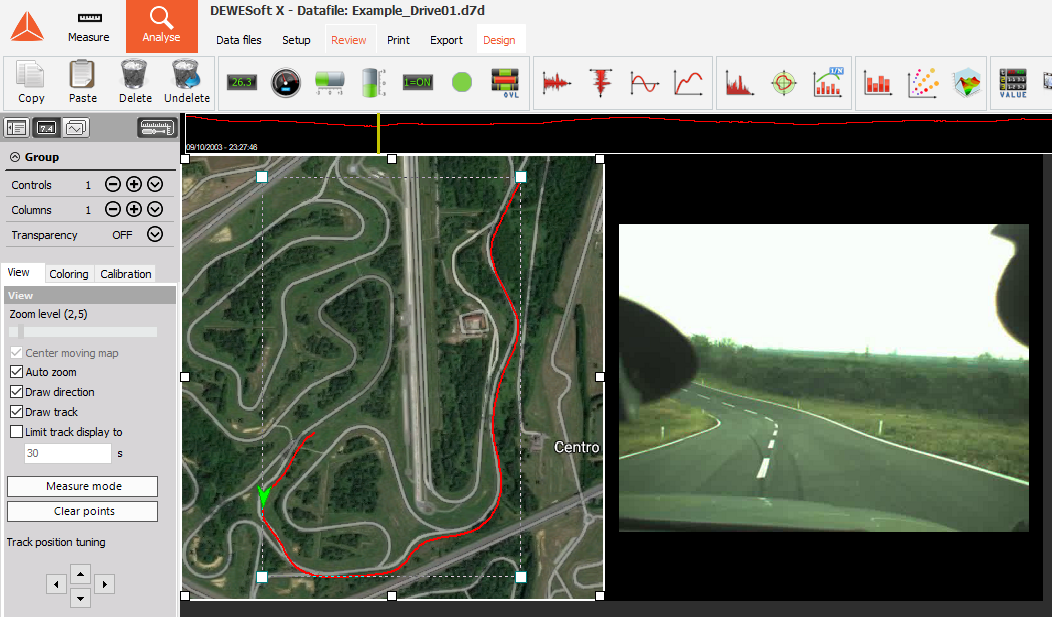
Appearance on screen
The GPS instrument consists of three parts of display:
- the course
- an arrow displaying the direction
- a scale indicator at the right bottom area of the instrument
For detailed information about instruments positioning, size and transparency see -> Screen edit functions.
Settings
The GPS instrument can be switched in two modes using the tabs:
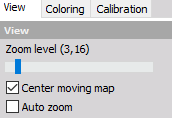
View setting
- Zoom - Dewesoft offers two ways to scale the track: Auto zoom or zoom manually.
Use the Zoom level slider to zoom manually; above the slider after caption, you can see the zoom factor.
Use the Center moving map option to keep the track centered on the screen.
When you select the Auto zoom option, the track will be centered automatically in the same way than described above.
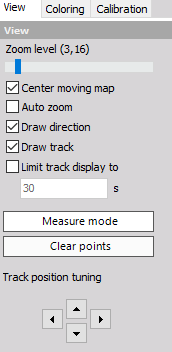
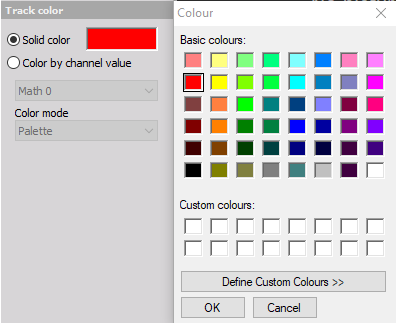
- Use the Track color to change the color of the displayed track. This feature is very helpful to achieve a good contrast to background maps.
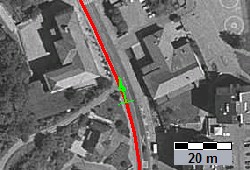
- When you select the Measure mode you can measure distances within the map. Simply click a point within the map for the starting point. Move the cursor to the second desired position and click again - a line will be drawn with the distance labeled:
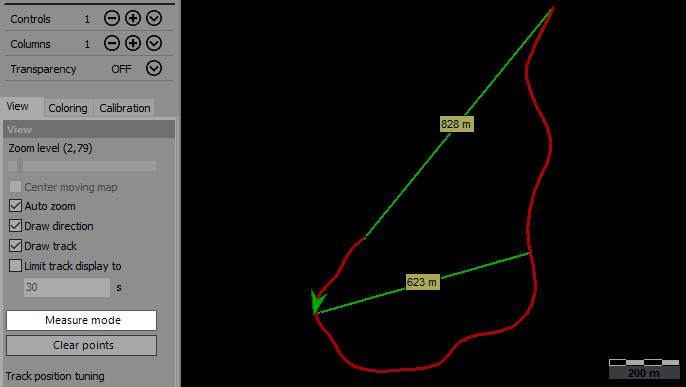
You can make as many measurements as you want. To remove the measurements, press the Clear points button.
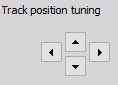
- Track position tuning - When the Auto zoom is deselected, you can use the arrow buttons to move the track within the map. You can also use the mouse: click on the track, keep the mouse button pressed and move the track to the desired position.
Calibrate Map
Dewesoft offers the possibility to display a background image behind the track. As a standard, the image will be a road map. To calibrate the map you have to perform several steps.
Calibrate from track
First press the Load map button to load the map from your system - maps directory. Accepted file formats are *.bmp or jpg.
Now you can define the map position. When Calibrate from -> track is selected, click on the map image, keep the mouse button pressed and move the map image as required. To re-size the map image, use the Design zoom slider.
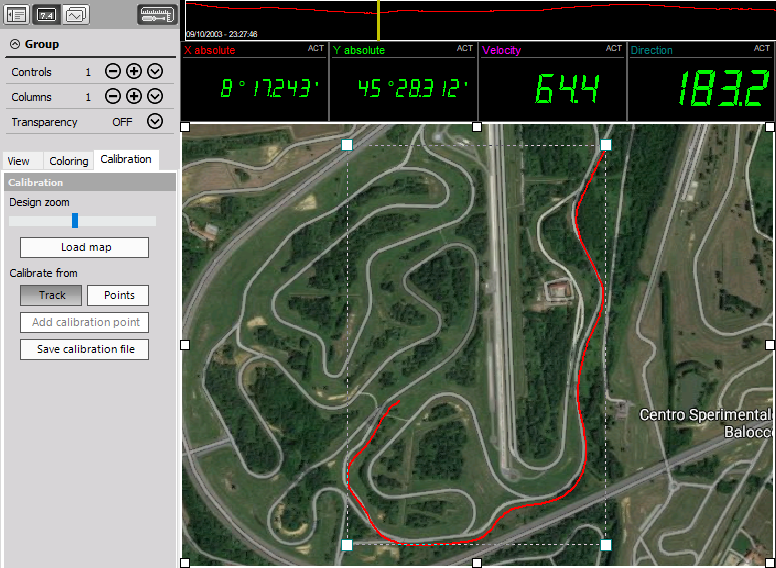
If we don’t know the coordinates of the map, we can take a short tour in the area storing the measurement. Then we go to GPS screen, go to Calibration and Load map. The map is shown in behind and the traveled path gets four handles around it. Now we can drag and adjust those handles to match the position and map.
If we know the exact coordinates on the map, we can also enter them by switching to Calibrate from -> points mode. Once this is adjusted, we can Save calibration file. This map will be from that point on always shown behind each measurement. We can also have multiple files for different zoom levels. We can have an overview file like above and when we zoom in, it will switch to the photography.
Calibrate from points
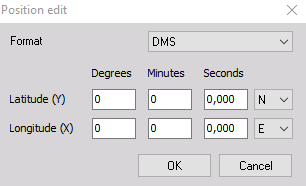
If Calibrate from -> points is selected, you can add calibration points. Press the Add calibration point button first and then the point within the map. A Position edit new window will appear where you can enter the GPS position.
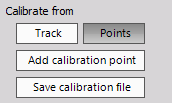
Add several points to complete the calibration by points and make it more accurate - at least two points are required.
After you have done these settings, press the Save calibration button to store the calibration settings. These values will be loaded automatically when you analyse the recorded data.