Thermodynamics Widget
The Thermodynamics widget is a phase diagram of fluids at different thermodynamic positions and states. This widget is to be used together with the Thermodynamics module.
Widget Setup
Automatic
The Thermodynamics application module, there will be a pre-defined display template available when going to Measure mode like shown below:
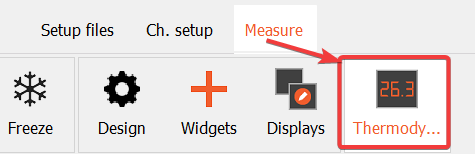
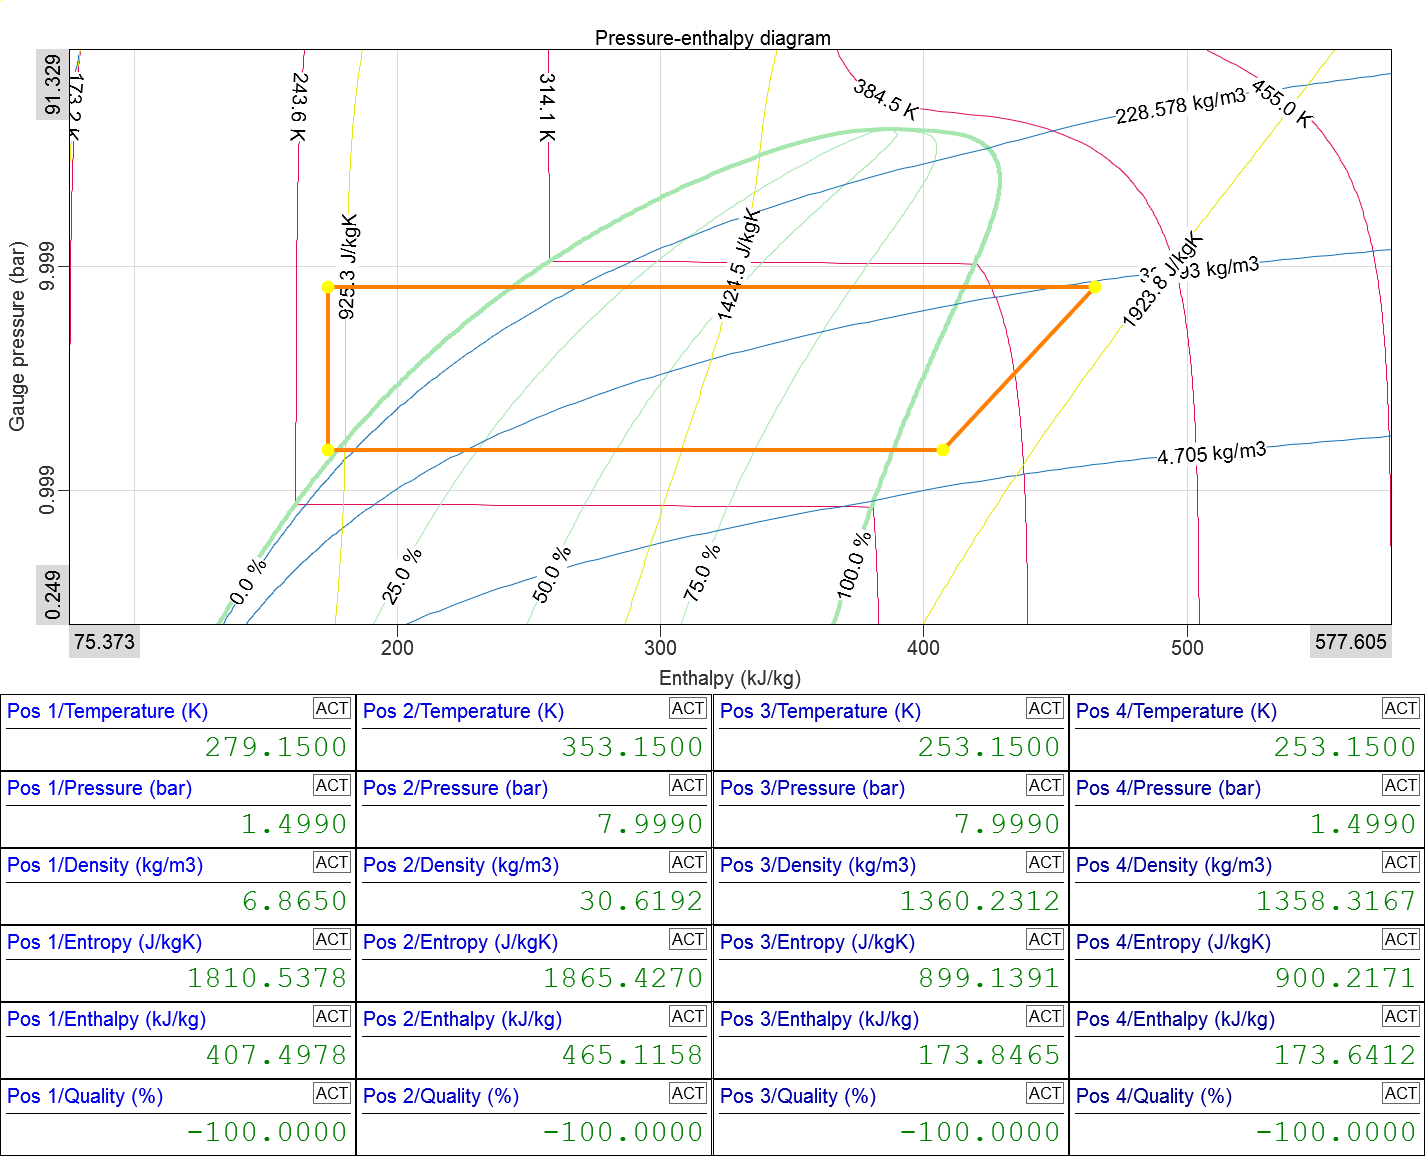
After opening the template, you will see the Thermodynamics widget and Digital meter widgets showing thermodynamic properties for each measurement position.
Manual
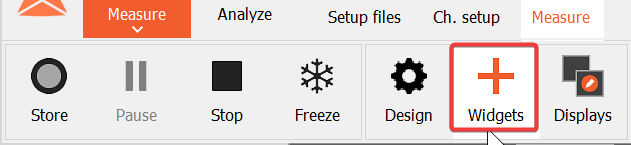
In Measure mode, click the + Widgets button:
Select the Thermodynamics widget with the icon as shown below:
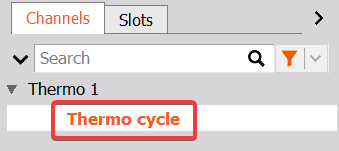
When the widget has been added, select a channel group from a Thermodynamics module in the Channel tab on the right of the screen:
Widget Interactions
Readout values
Place your mouse cursor anywhere on the graph to get an instant readout:
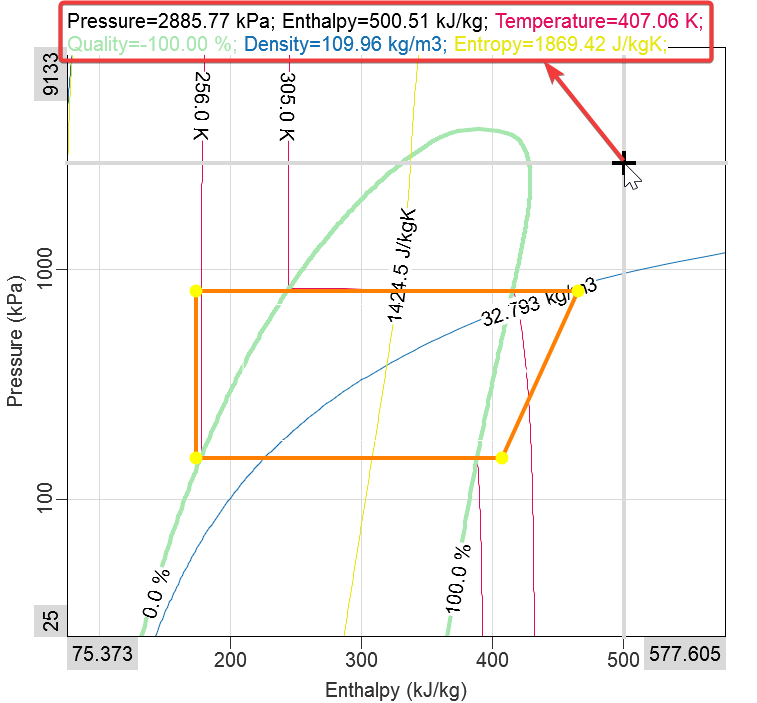
This helps with quick investigations and keeping an overview. It can also be used to help determine reference cycle positions.
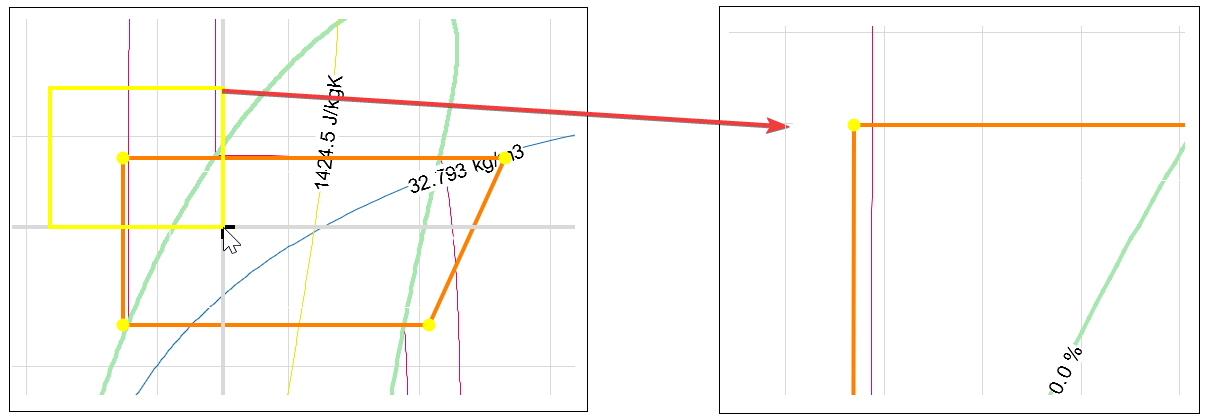
Drag and Zoom
To zoom into an area, left-click hold and drag the mouse over the part of the graph you wish to zoom into. You will see a yellow rectangle appear. When you release, the graph will be zoomed into the area marked by the rectangle. To zoom out, right click anywhere on the widget.
Widget Properties
The Thermocycle widget has multiple property sections as listed below:
- Thermodynamics widget Control properties - applicable to all widgets, please consult the linked section of the manual.
- Display options
- Reference cycle
- Measured cycle
- Temperature (for p-h) / Pressure (for T-s) isolines
- Quality isolines
- Density isolines
- Entropy (for p-h) / Enthalpy (for T-s) isolines
Display Options
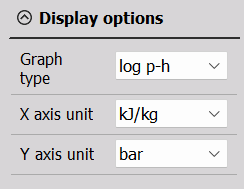
- Graph type
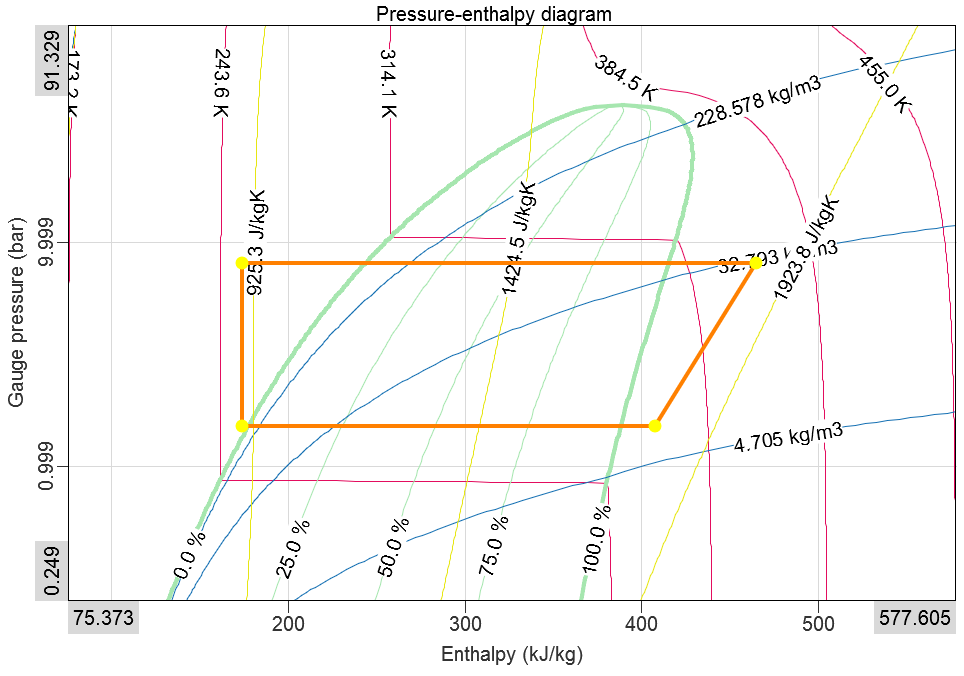
- p-h - pressure vs. enthalpy diagram with linear axes
- log(p)-h - pressure vs. enthalpy diagram with a logarithmic pressure axis
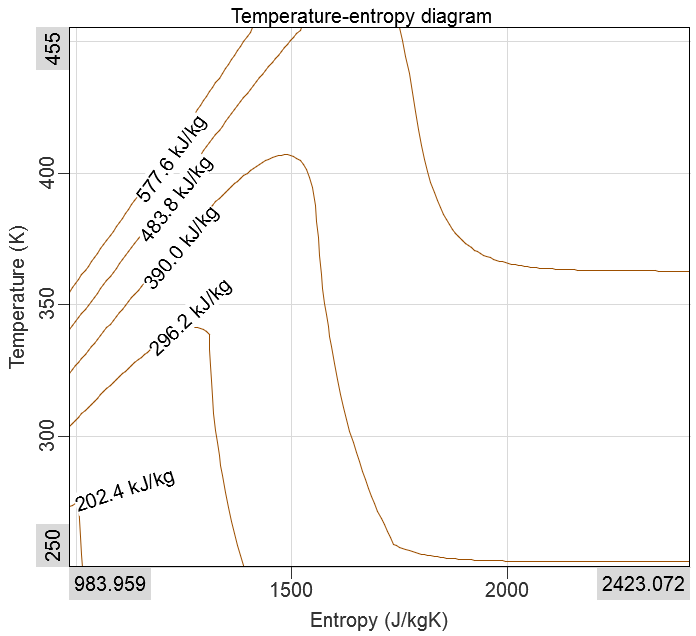
- T-s - temperature vs. entropy diagram with linear axes
- X axis unit - J/kg, kJ/kg, MJ/kg
- Y axis unit
- p-h diagrams: Pa, hPa, kPa, MPa, bar, mbar, and psi
- T-s diagrams: K, ºC, and ºF
Reference Cycle
The Reference cycle plots data calculated from the Thermodynamics Reference cycle table.
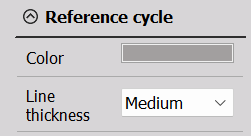
Color and Line thickness can be adjusted.
Measured Cycle
The Measured cycle plots data calculated from the Thermodynamics Input channel table.
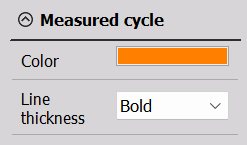
Color and Line thickness can be adjusted.
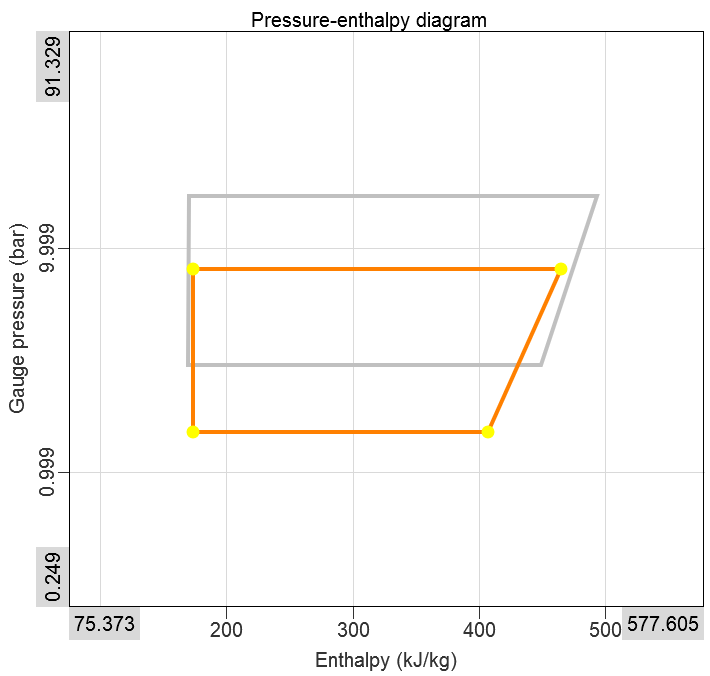
The Reference cycle is plotted below the Measured cycle:
Isolines
In order to follow all thermodynamic properties, the Thermodynamics widget supports overlaid isolines for all quantities that aren’t already on the axes, p-h or T-s.
For p-h diagrams, you can configure isolines for:
- Temperature
- Quality
- Density
- Entropy
For T-s diagrams, you can configure isolines for:
- Quality
- Density
- Pressure
- Enthalpy
Common Isolines Settings
Isolines can be enabled individually, and can have the following properties adjusted:
- Enable
- Color
- Unit
- Line thickness
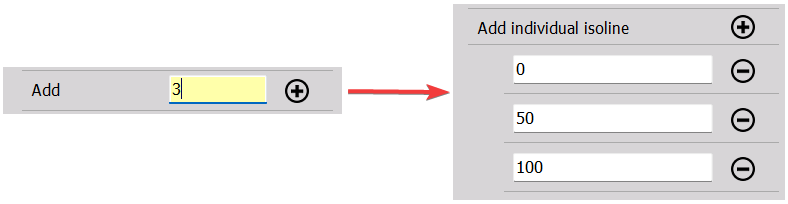
For all isoline types, you can either enter individual desired isolines manually, or you can select how many isolines you want to have evenly spread, as shown below:
Temperature Isolines
Available for p-h diagrams.
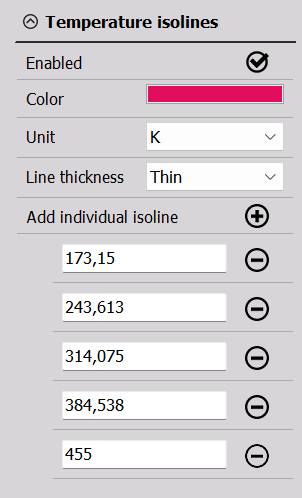
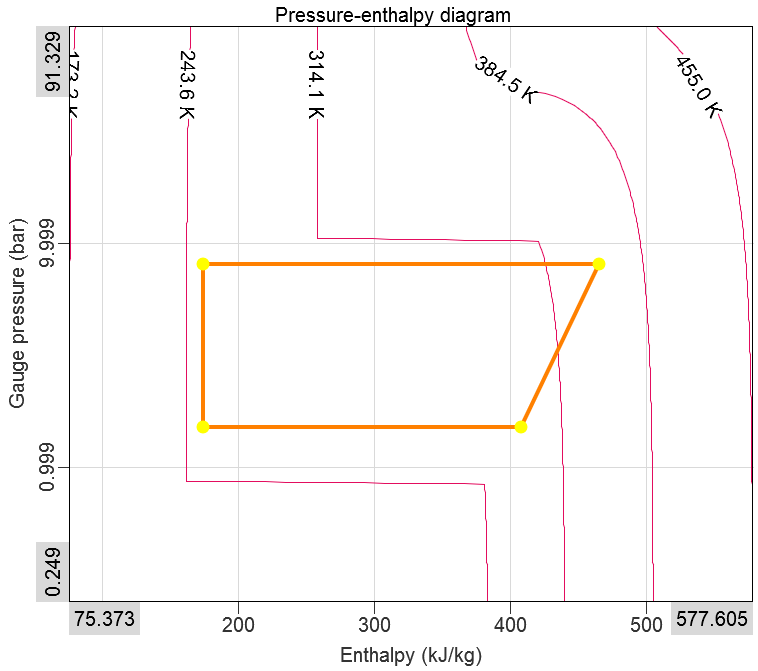
Either a user-defined number of evenly spread Temperature isolines or specific isolines can be plotted, which will follow a fixed temperature across the axes:
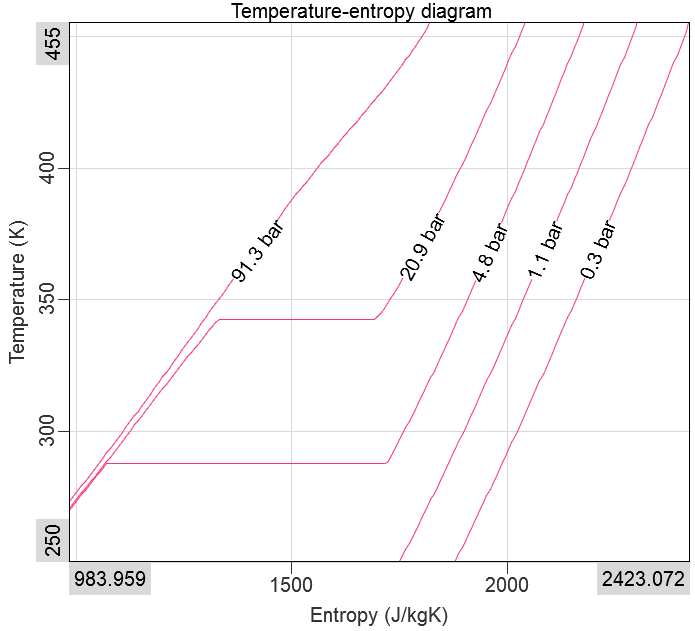
Pressure Isolines
Available for T-s diagrams.
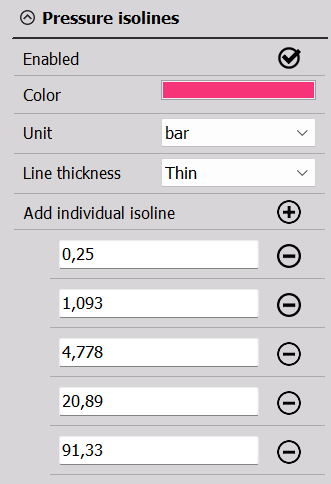
Either a user-defined number of evenly spread Pressure isolines or specific isolines can be plotted, which will follow a fixed pressure across the axes:
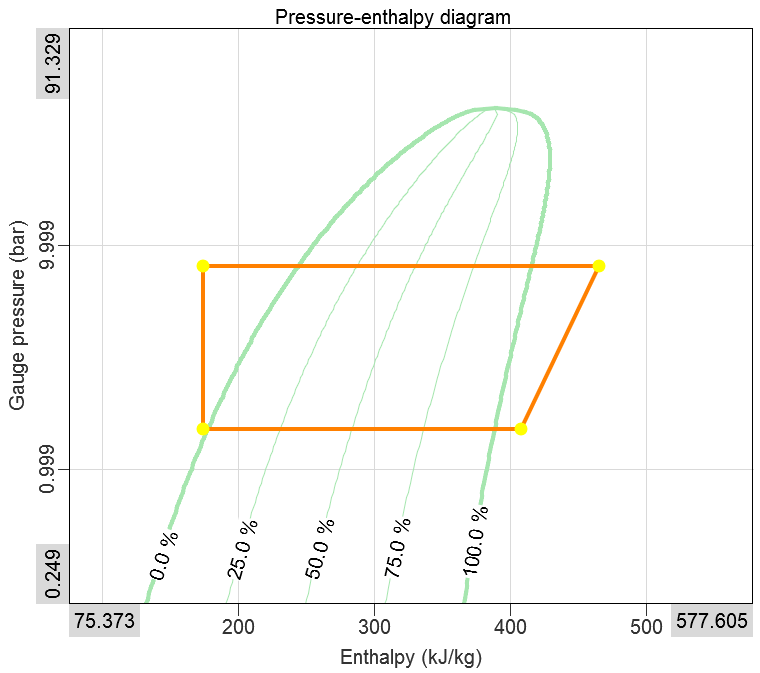
Quality Isolines
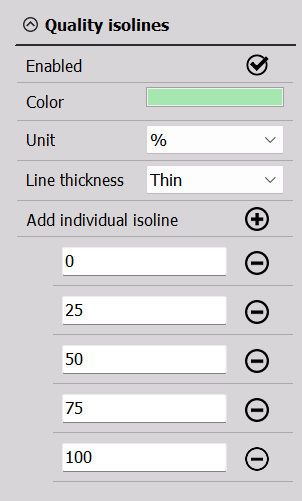
Either a user-defined number of evenly spread Quality isolines or specific isolines can be plotted, which will follow a fixed quality number across the axes within the saturation curve:
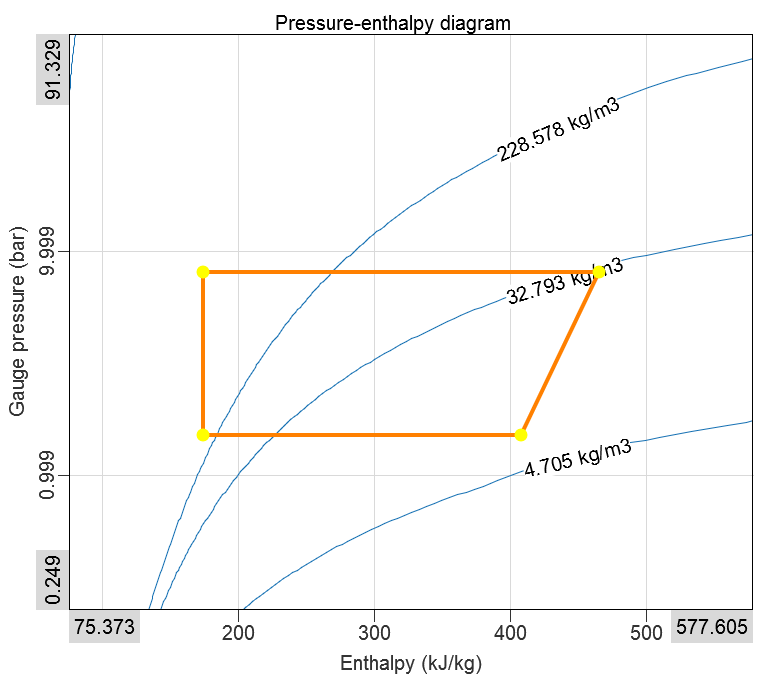
Density Isolines
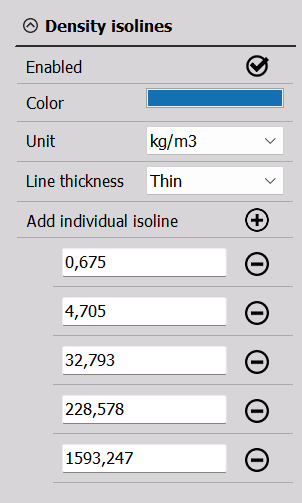
Either a user-defined number of evenly spread Density isolines or specific isolines can be plotted, which will follow a fixed density across the axis ranges:
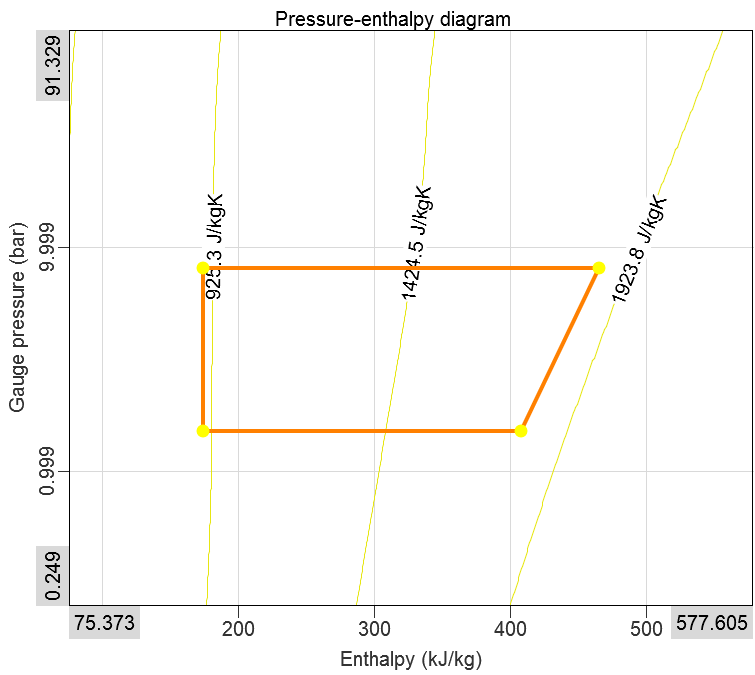
Entropy Isolines
Available for p-h diagrams.
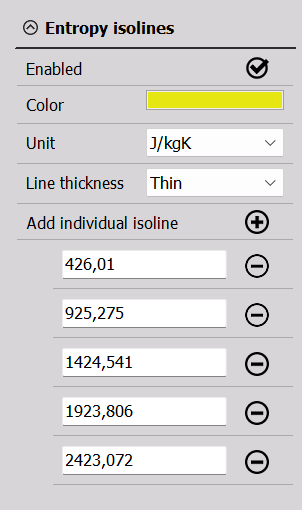
Either a user-defined number of evenly spread Entropy isolines or specific isolines can be plotted, which will follow a fixed entropy across the axes:
Enthalpy Isolines
Available for T-s diagrams.
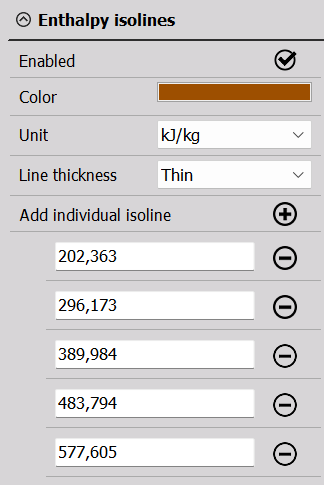
Either a user-defined number of evenly spread Enthalpy isolines or specific isolines can be plotted, which will follow a fixed entropy across the axes.