Thermodynamics
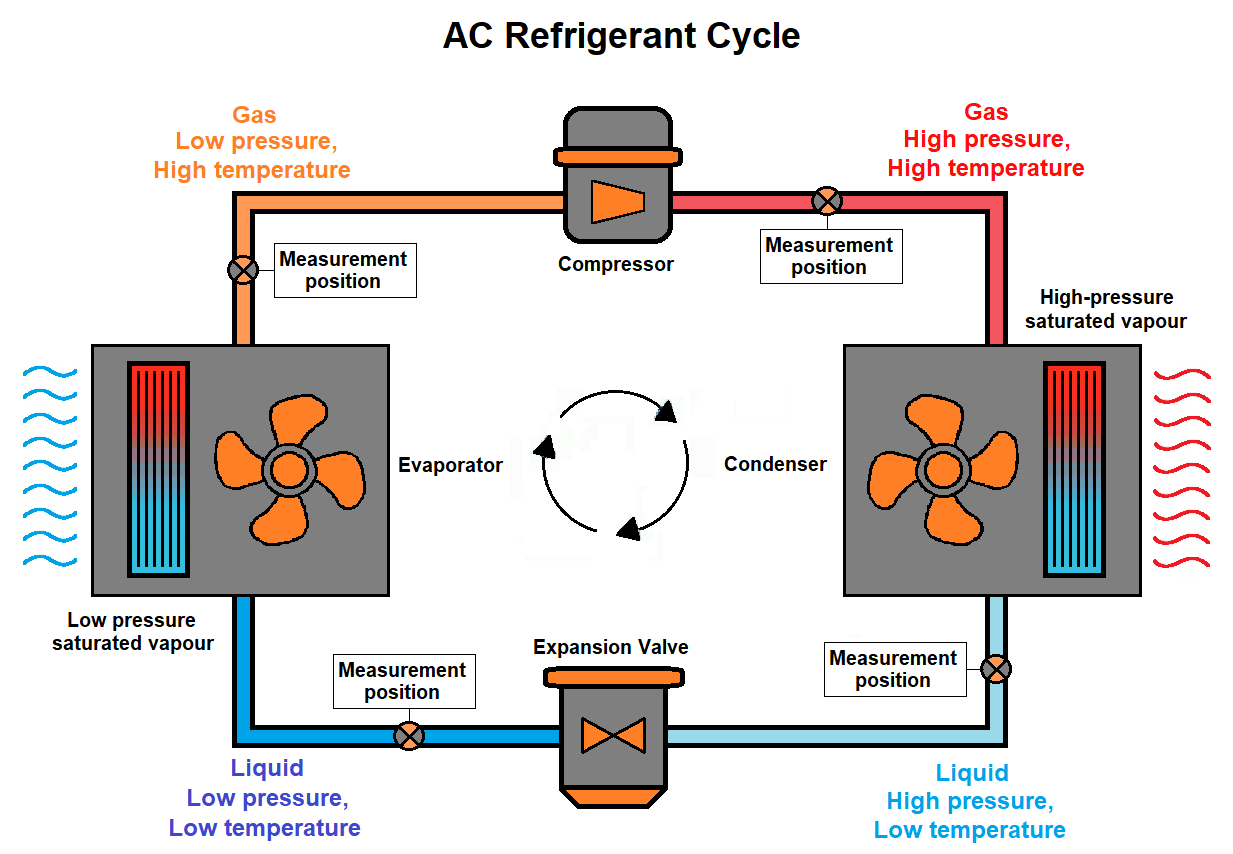
The Thermodynamics application module makes it possible to calculate and analyze thermodynamics properties like enthalpy and density of fluids in different states. Below is an example for a common heat transfer system using a refrigerant in different states:
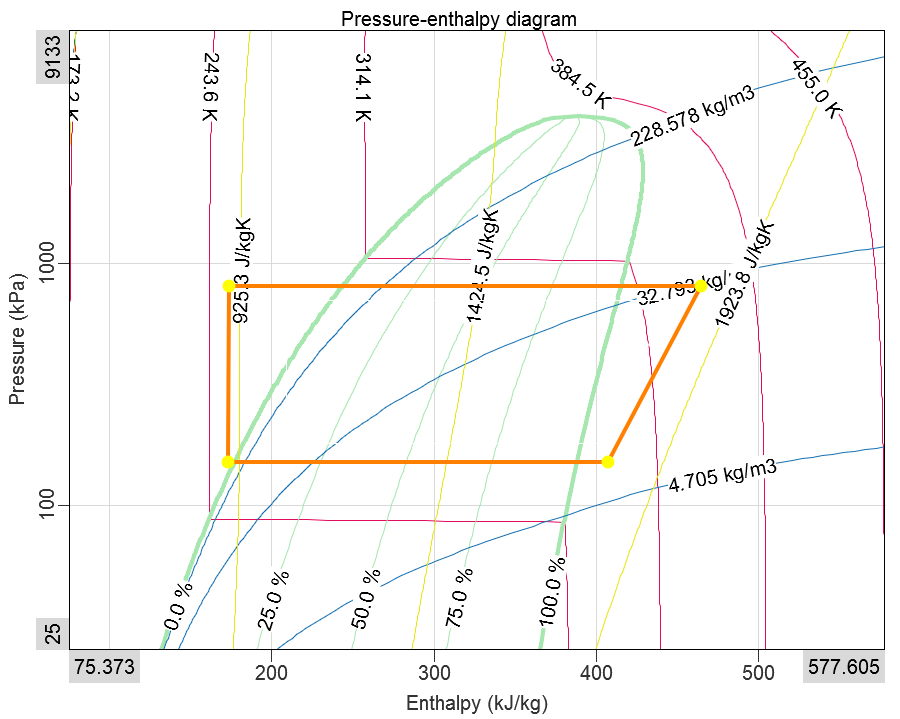
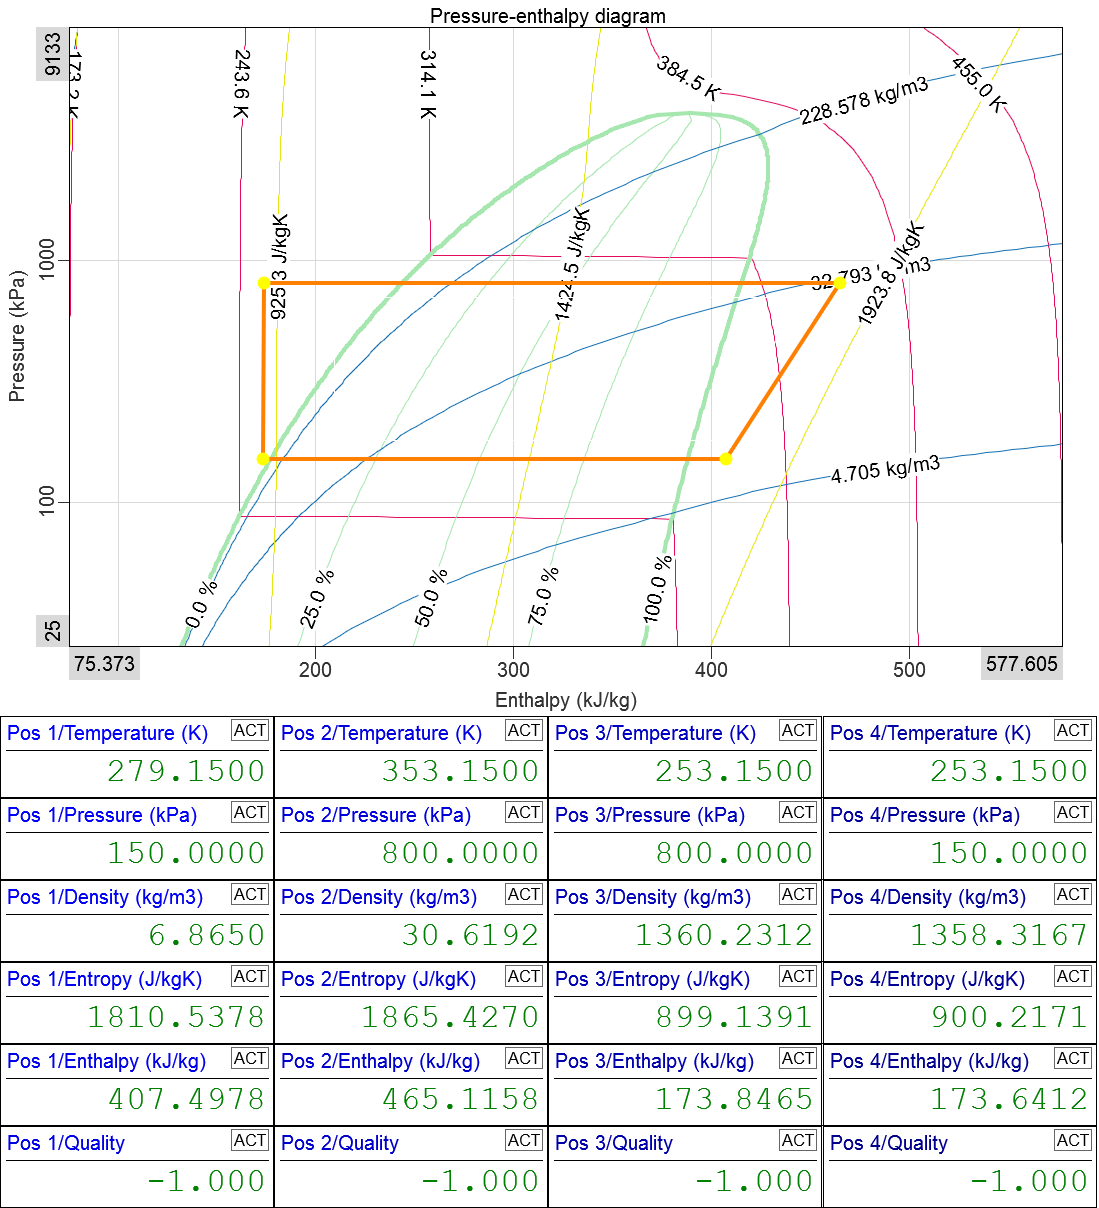
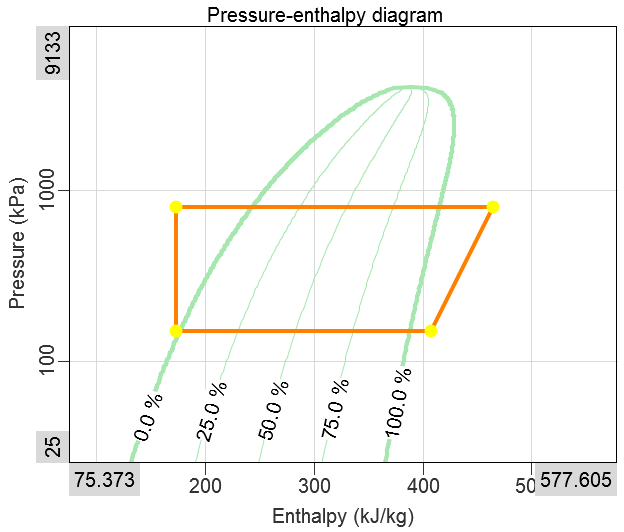
This application module should be used together with the Thermodynamics widget which represents a phase diagram of the used fluid at different locations and states, like shown below:
Applications
Thermodynamic analysis of fluids in different states and positions within a closed system is crucial in a variety of engineering and industrial applications. Below are listed some application examples:
Refrigeration Systems
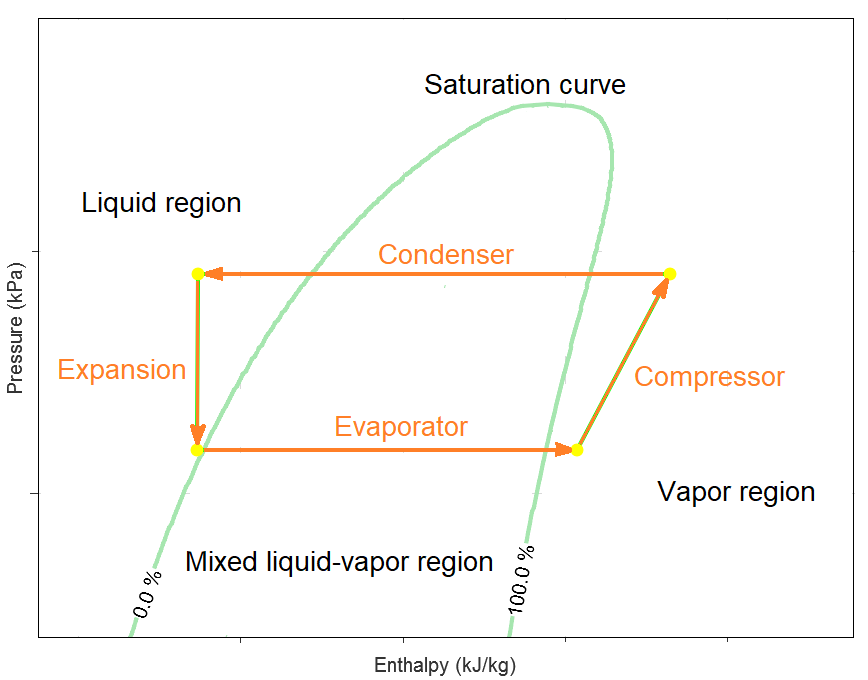
In refrigeration cycles, such as those in refrigerators, air conditioners, or large-scale industrial chillers, pressure-enthalpy (p-h) diagrams are used to map out the processes that the refrigerant undergoes. Key processes such as compression, condensation, expansion, and evaporation, shown in the image below, are analyzed to optimize the efficiency of heat removal and ensure proper system performance.
Heat Pumps
Similar to refrigeration systems, heat pumps use p-h diagrams to analyze the thermodynamic cycle. Here, the analysis helps in heating applications, with the system configured to extract heat from the surroundings and deliver it indoors or to another space.
Power Generation
In power plants, particularly those using steam turbines, thermodynamic analysis with phase diagrams is vital. Engineers use these analyses to visualize the Rankine cycle, optimize steam usage, and improve overall plant efficiency. Assessment of changes in fluid states at different pressure and temperature levels helps in turbine design and performance evaluation.
Others
Other examples of applications where thermodynamic analysis and pressure-enthalpy diagrams are used are e.g.:
- Automotive Air Conditioning
- Cryogenic Systems
- HVAC Systems
Enthalpy and Entropy
Enthalpy and entropy are fundamental thermodynamic properties that play a crucial role in analyzing and optimizing cooling systems. Their relevance stems from their connection to energy transformations and reversibility of processes.
By evaluating both enthalpy and entropy, you can conduct comprehensive cycle analysis — enabling the calculation of work inputs, heat transfers, and efficiency in each component of a cooling system.
The interplay of enthalpy and entropy influences decisions regarding refrigerant selection, system design, and operational settings to optimize performance and sustainability.
Continuous assessment of these properties in real-time helps in identifying operational anomalies, facilitating preventive maintenance, and ensuring system reliability.
Enthalpy (h)
Relates to energy transfer. Enthalpy is a measure of the total energy of a thermodynamic system, including internal energy plus the product of pressure and volume. It represents the heat content of the fluid at a given point.
Heat Exchange:
Enthalpy changes are directly related to heat transfer in the system, making it critical for analyzing components like compressors, condensers, evaporators, and expansion valves.
Phase Changes:
During phase transitions (evaporation and condensation), enthalpy changes without a change in temperature at constant pressure, which is crucial for understanding the cooling effect.
Efficiency Analysis:
Using p-h diagrams, tracking enthalpy allows engineers to calculate useful work output or input and determine the efficiency of various components within the cycle.
Entropy (s)
Entropy relates to disorder and reversibility. Entropy is a measure of the disorder or randomness of a system, reflecting the number of ways the system’s state can be arranged. It also indicates the potential for energy dispersal.
Efficiency and Irreversibility:
Entropy helps evaluate the irreversibility and inefficiencies within a thermodynamic process. Higher entropy generation typically indicates greater energy losses.
2nd Law of Thermodynamics:
Entropy principles determine the feasibility and directionality of processes. In cooling systems, entropy analysis ensures that processes adhere to natural laws, helping to identify areas for improvement.
Quality of Energy:
Entropy changes indicate the degradation of energy quality during transformations, which is crucial for maximizing useful energy output.
Entropy Change Assessment:
On a temperature-entropy (T-s) diagram, entropy changes illustrate the degree of irreversibility in the cycle, providing insights into thermodynamic efficiencies.
Module setup
Add the module to the setup
In order to configure the Thermodynamics module, click “More…” with the + icon in Ch. setup:

Then select the Thermodynamics module with the icon as shown below:

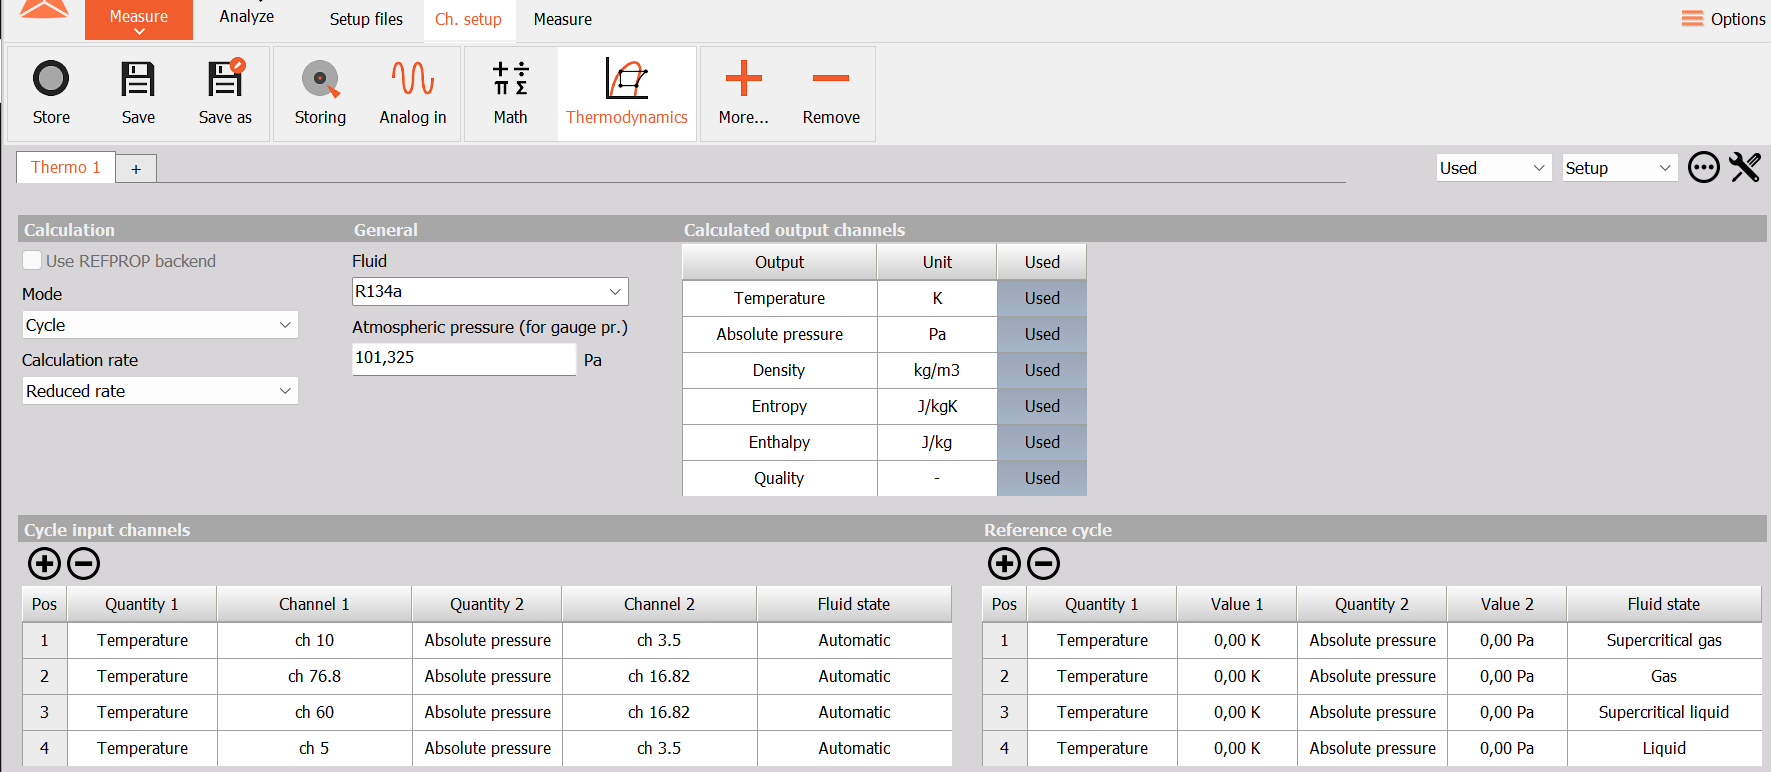
When the module is added the setup will be shown:
Results
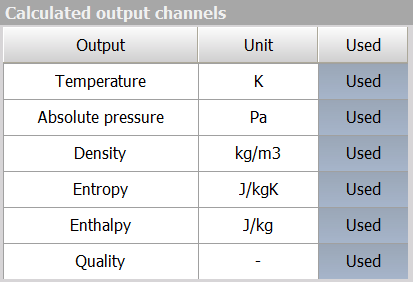
For all defined positions the following results can be selected to be calculated for a given fluid type:
- Temperature - can be specified in Kelvin $[K]$, degrees Celsius $[ºC]$, and degrees Fahrenheit $[ºF]$
- Absolute pressure or Gauge pressure - pressure relative to vacuum or set Atmospheric pressure respectively, specified in $[Pa]$, $[hPa]$, $[kPa]$, $[MPa]$, $[bar]$, $[mbar]$, and $[psi]$
- Density - mass per unit volume, specified in $[kg/m^3]$, $[g/cm^3]$, and $[lb/ft^3]$
- Entropy - a measure of dispersed energy, specified in $[J/kgK]$, $[kJ/kgK]$, and $[MJ/kgK]$
- Enthalpy - a measure of energy in a thermodynamic system, specified in $[J/kg]$, $[kJ/kg]$, and $[MJ/kg]$
- Quality - the fraction of vapor in a liquid-vapor mixture, specified as a unitless number between 0-1 $[-]$ or in percent $[$%$]$
Each defined position must have two of these quantities measured to calculate all outputs. This is setup in the Input channel table.
Display templates
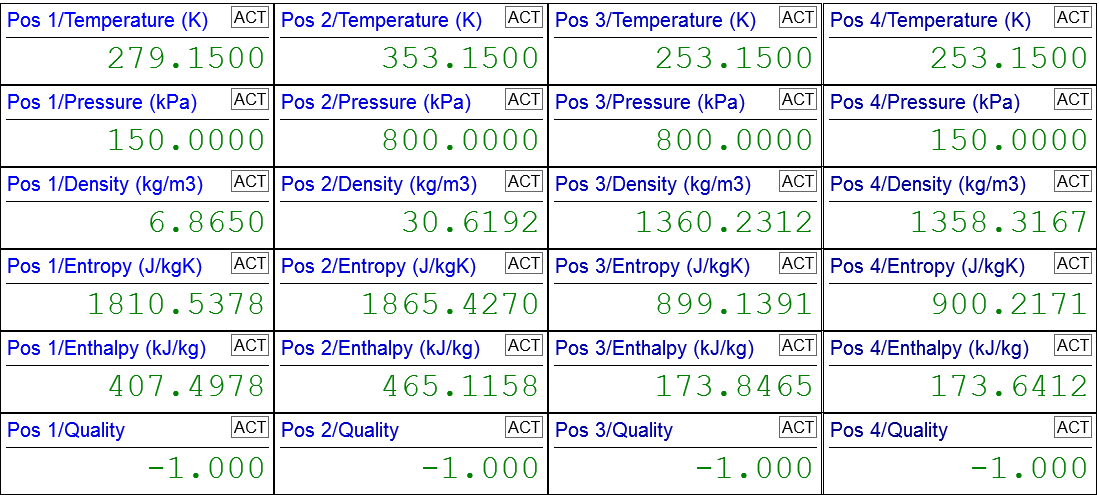
With the Thermodynamics module comes a pre-defined display template to use when going to Measure. The template is designed with a Thermocycle plot widget in the top and with all thermodynamic properties listed below in columns for each measurement position.
General settings
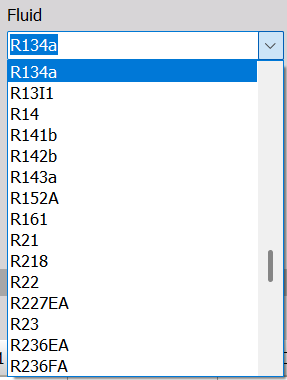
Fluid
Select between around 110 fluids supported by the CoolProp library, or between even more using the REFPROP library. Note, to use the REFPROP library a paid version of the REFPROP .dll file is required.
When selecting a fluid you must consider factors like
- Thermodynamic efficiency,
- compatibility with materials,
- Safety
- environmental regulations and impact,
- costs,
- specific cooling requirements of the application.
Fluid examples
For example in cooling systems, various types of fluids, known as refrigerants, are commonly used. Below are some typical types of refrigerants used:
Chlorofluorocarbons (CFCs), like R-12:
Although effective in cooling, CFCs are no longer widely used due to their significant ozone-depleting potential and have been phased out under the Montreal Protocol.
Hydrochlorofluorocarbons (HCFCs), like R-22:
HCFCs have lower ozone depletion potential than CFCs and were used as transitional replacements. However, they are also being phased out due to environmental regulations.
Hydrofluorocarbons (HFCs), like R-134a, R-410A, R-404A:
Commonly used as replacements for CFCs and HCFCs, HFCs do not deplete the ozone layer but have high global warming potential, leading to increased regulation.
Hydrofluoroolefins (HFOs), like R-1234yf, R-1234ze:
HFOs are developed to replace HFCs due to their significantly lower global warming potential, offering environmentally friendlier options for cooling systems.
Ammonia (R-717):
Widely used in industrial refrigeration, ammonia is valued for its high efficiency and zero ozone-depleting potential. However, its toxicity and flammability require careful handling and system design.
Carbon Dioxide (R-744):
CO2 is experiencing a resurgence, especially in transcritical refrigeration systems, due to its non-flammability, low cost, and near-zero ozone-depleting potential. It is particularly popular in commercial and industrial applications.
Hydrocarbons, like Propane (R-290), and Isobutane (R-600a):
These natural refrigerants are used due to their low environmental impact and excellent thermodynamic properties but are flammable, necessitating safety measures in system design.
Water (R-718):
Sometimes used in absorption refrigeration systems and evaporative cooling, water is non-toxic and environmentally benign but limited to certain specific applications due to its freezing point limitations.
Blends: Many cooling systems use blends of different refrigerants to achieve desired properties such as efficiency, safety, and environmental compliance. For example, R-407C is a blend often used as a substitute for R-22.
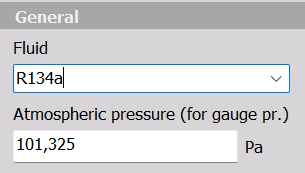
Atmospheric pressure (for gauge pr.)
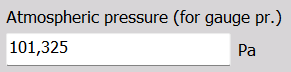
The Atmospheric pressure is required to correctly calculate the gauge pressure. The gauge pressure refers to the pressure of a fluid measured relative to the ambient atmospheric pressure. It differs from Absolute pressure, which is measured relative to a perfect vacuum.
Input channel table
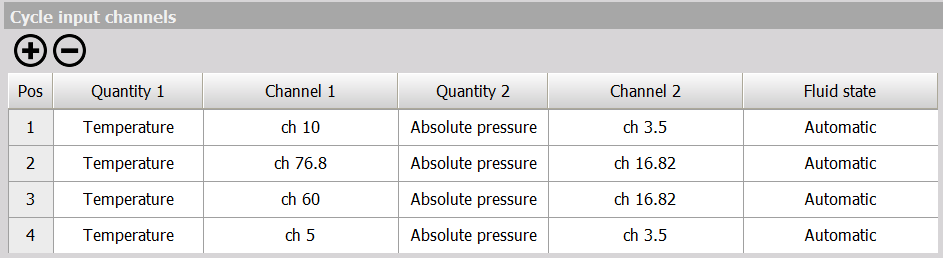
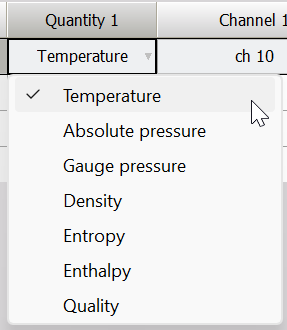
In the Input channel table you can select a user-defined number of measurement positions, for which two channels must be selected. Each of the two channels must represent one of the thermodynamic quantities specified below:
- Temperature
- Absolute pressure
- Gauge pressure
- Density
- Entropy
- Enthalpy
- Quality
These quantities are described a little more under the Results section, and can be selected in the dropdown lists for Quantity 1 and Quantity - 2 relating to the two selected input channels per measurement point:
For each measurement point you also have the option to specify the Fluid state. By default this is set to Automatic:
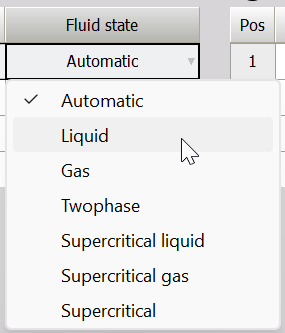
An attempt to show how the different fluid states relate to each other are illustrated below:
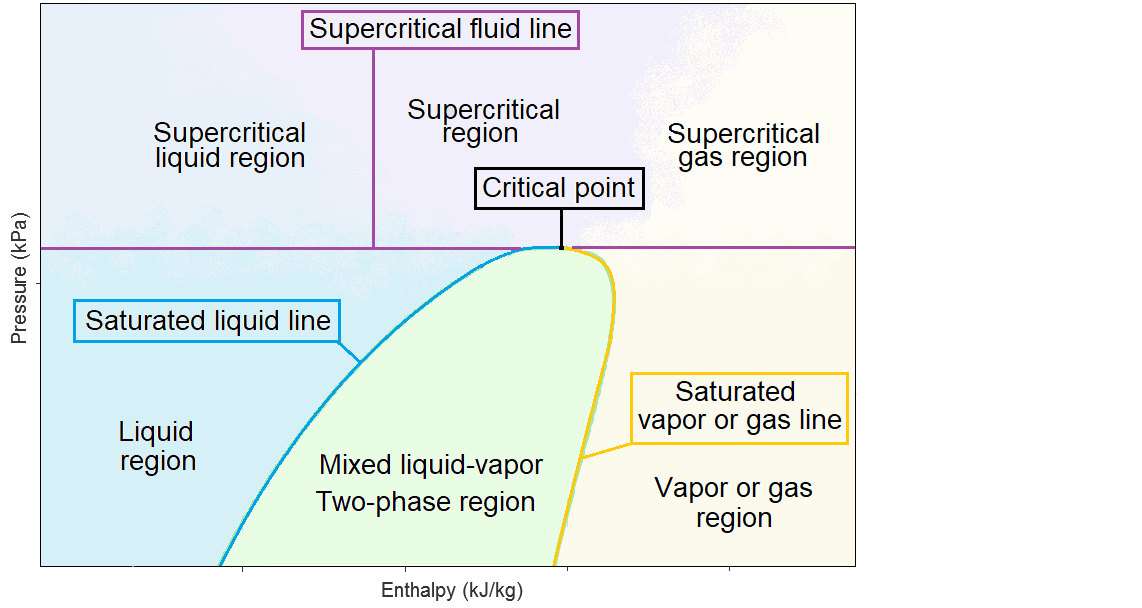
Critical Point:
The critical point on a p-h diagram is the point where the saturated liquid line (left curve) and the saturated vapor line (right curve) meet. It represents the highest temperature and pressure at which a liquid and vapor phase can coexist in equilibrium. Beyond this point, the distinctions between liquid and vapor phases disappear.
Beyond the critical point, the substance enters the supercritical fluid region, where it does not behave distinctly as either a liquid or a gas. Instead, it exhibits properties of both phases. It can fill a container like a gas, but with a density similar to that of a liquid.
As you move beyond the critical point, you aren’t really shifting between a supercritical liquid and a supercritical gas. This is more something to select between in the dropdown list for the processing library to have a better initial guess.
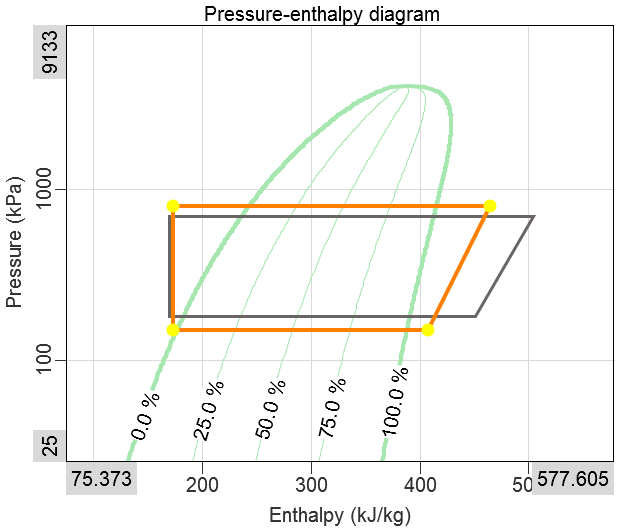
Reference channel table
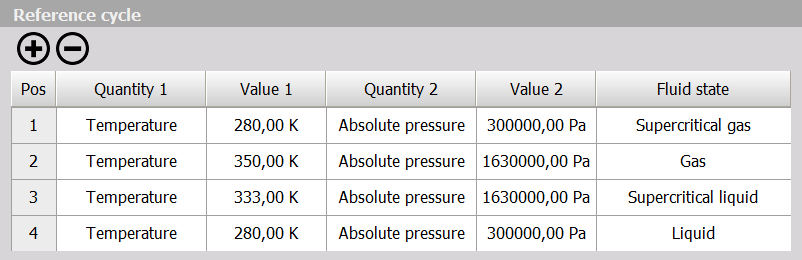
Similar to how you configure measured positions in the Input channels table, you can also configure reference positions to get a reference cycle overlaid in the phase diagram. In the picture below the reference cycle is colored dark grey:
The reference cycle is only available when the Calculation mode is set to Cycle.
Calculation settings
CoolProp and REFPROP calculation support
The Thermodynamics module can process and calculate data based on both CoolProp and REFPROP algorithms.
By default the CoolProp library is used, but if you have a dedicated licensed .dll for REFPROP, then you can select the REFPROP library to be used in the module.
Note: to use the REFPROP library a paid version of the REFPROP .dll file is required.
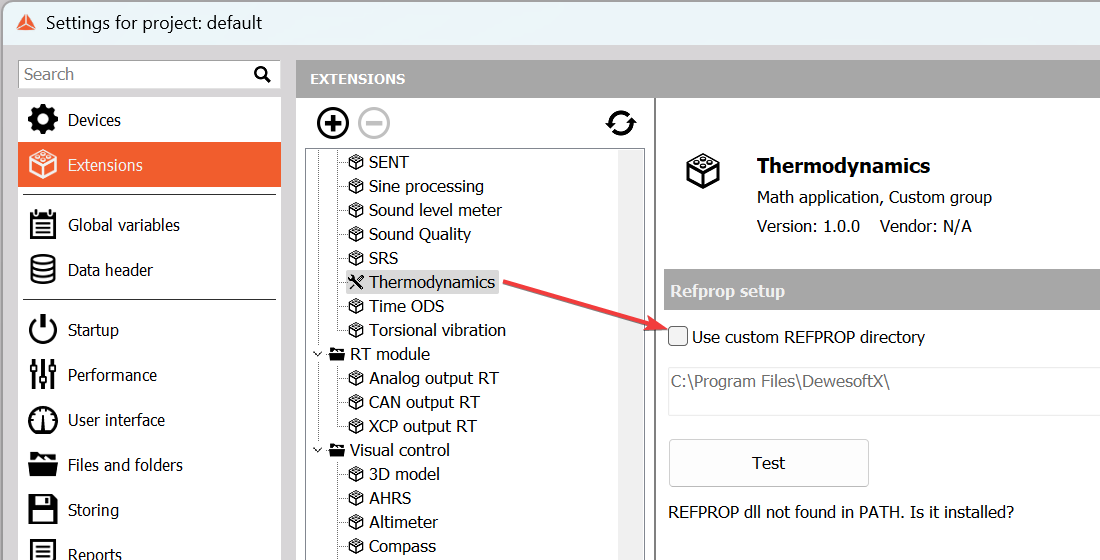
If the REFPROP .dll is not found, then click on the project settings icon in the top-right corner and modify the directory path:

For more information about the CoolProp library please see the links below:
CoolProp homepage:
CoolProp article:
REFPROP homepage:
https://www.nist.gov/srd/refprop
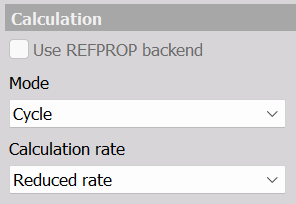
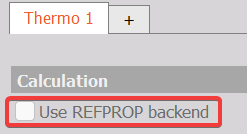
Calculation Mode
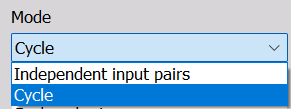
Choose between combined Cycle points or Independent input pairs. In Cycle mode the Input cycle points will be illustrated and visually connected on the Thermocycle plot widget.
When independent input pairs are selected the phase diagram will not highlight the points but just show the fluid diagram. In both cases the result data will be available on e.g. digital meter widgets and shown below:
Calculation rate
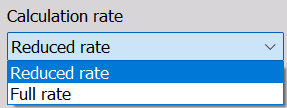
Select between having the data results calculated with either:
- Full rate - produce results with the same full rate as the used input channels have. Note, this can be performance heavy and slow down the data processing speed.
- Reduced rate - produce results with a rate set after the Acquisition update rate, found under Performance in the project settings, as shown below:
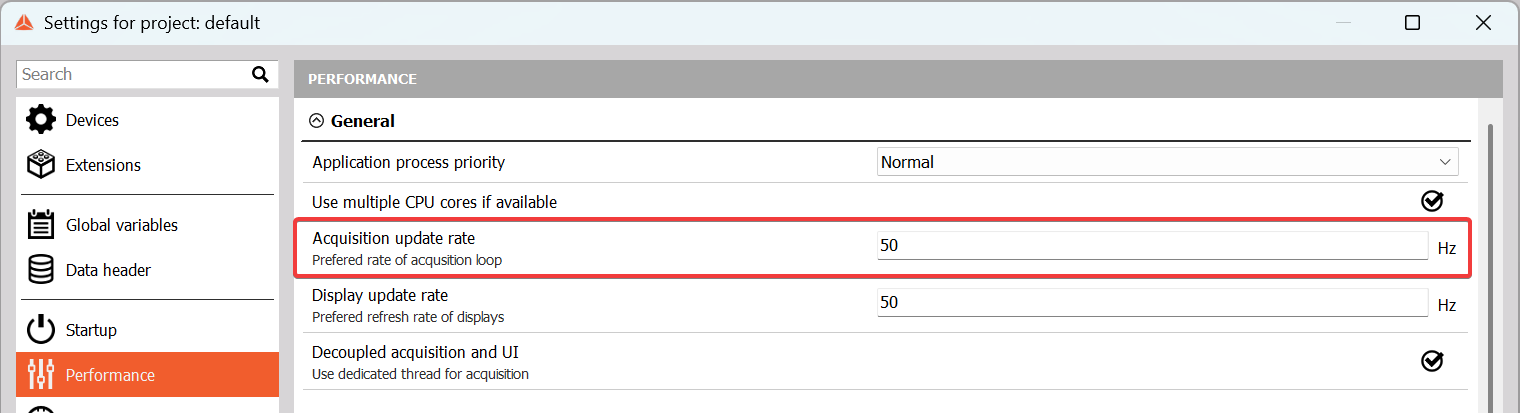
The default Acquisition update rate is 50 Hz, which should be sufficient for the majority of applications.