Performance Monitor
The DewesoftX Performance Monitor will enable you to check how your computer is handling measurements.
It can be enabled in three ways:
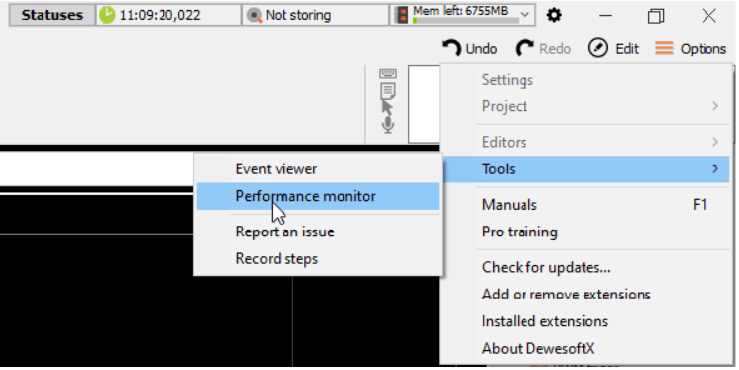
- Click Options - Tools - Performance monitor.
Press CTRL + SHIFT + P.
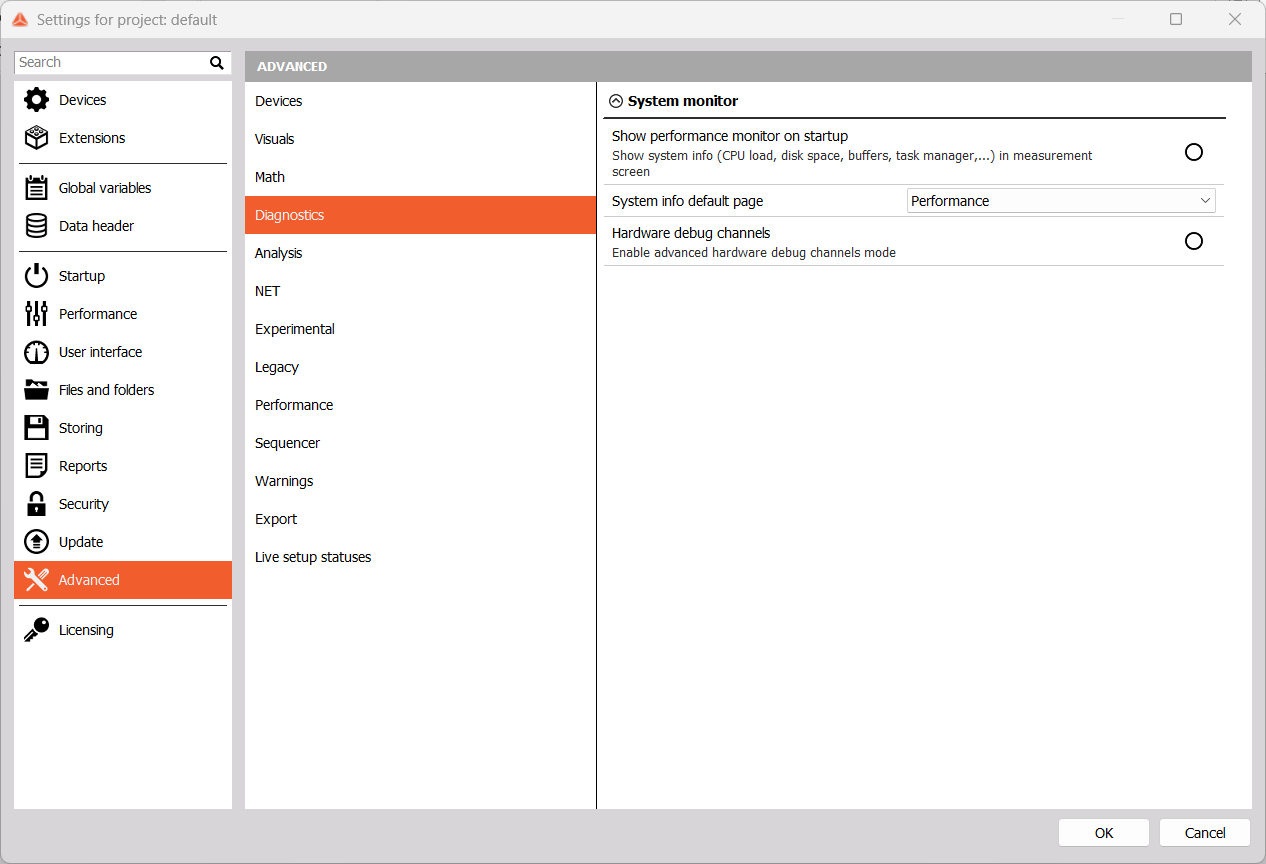
You can choose to show the Performance monitor by default in Settings - Advanced - Diagnostics. You also can choose between setting the Performance and Tasks manager (details) page as default.
NOTE: For more information about the System monitor, please refer to the System monitor section of the manual.
The Performance monitor has two tabs, Performance and Details (Task manager):
Performance:
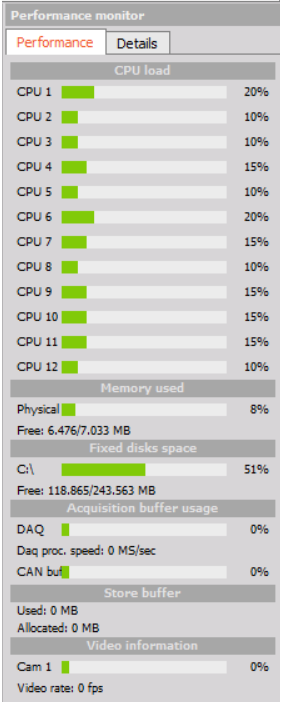
CPU load - shows how many logical processors the computer is using, and how much, as a percentage.
Memory used - shows how much memory the computer has and how much is used. It is possible to reduce usage by decreasing the sync and async buffers or disabling the freeze option Options - Settings - Performance.
Fixed disk space - shows the amount of the free space on internal disk.
Acquisition buffer usage - shows the amount of the memory used for the acquisition. If the buffer is increasing, the system is approaching its limit. It is possible that the USB/Ethernet speed limit is exceeded.
Store buffer - shows the amount of memory used for storing. If the buffer is increasing, the system is at its limit. It is possible that the disk write speed limit is exceeded.
Video information - shows the amount of memory used for the camera. If the buffer is increasing, the system is at its limit.
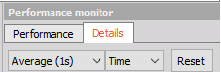
Details:
You can choose how often the Performance monitor will update Details:
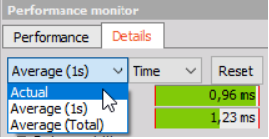
- Actual - takes data which is updated once per acquisition loop.
- Average (1s) - takes averaging data of 1 s.
- Average (Total) - takes averaging data from acquisition start or from pressing reset button.
NOTE: Acquisition update rate (Prefered rate of Acquisition loop) can be changed in Options - Performance - Acquisition update rate.
You can also choose how the data will be displayed:
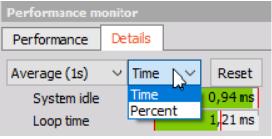
- Time - shows used time of operation in ms.
- Percent - shows used time of operation as a percentage of total loop time.
Pressing the Reset button starts new averaging.
The following information will be displayed in this tab:
- Data acquisition - Devices you have connected and their processing time.
- Processing reduced time - This is the amount of time to calculate the reduced buffer.
- Math - This list will show all math modules or formulas you are currently using.
- Display - This time depends on the number of displays because each display in Measure mode requires some processing time.
- Plugins - All used plugins are shown here.