Fatigue analysis
Fatigue Analysis Module supports a wide range of fatigue analysis features and utils.
After we press add new Fatigue analysis module screen like this will appear:
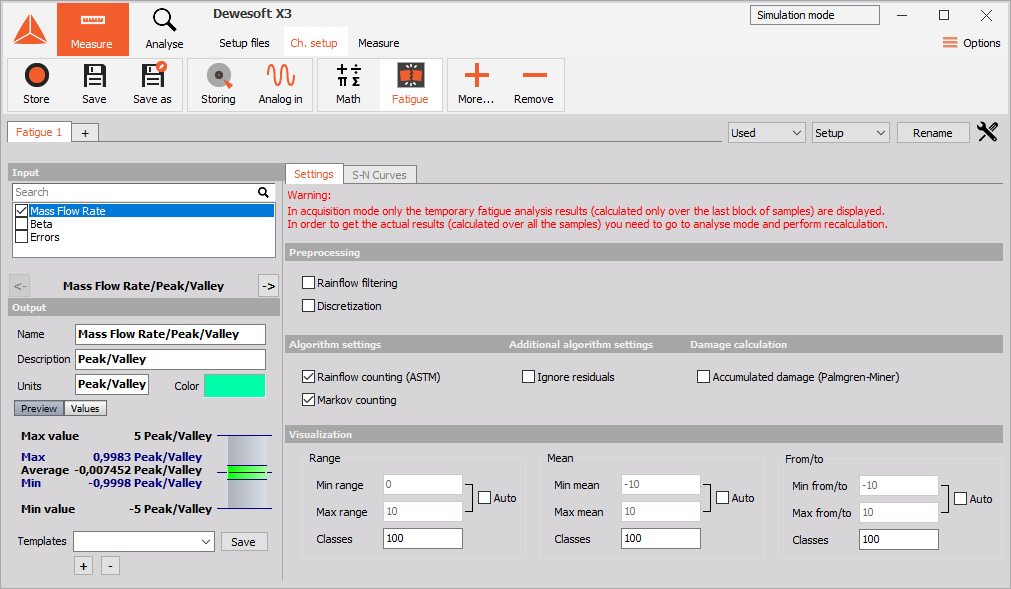
The module is organized into three main sections:
NOTE: In acquisition mode, only the temporary fatigue analysis results (calculated only over the last block of samples) are displayed. In order to get the actual results (calculated over all the samples) you need to go to analyse mode and perform recalculation!
Preprocessing
Rainflow filtering
Rainflow filter (also called the hysteresis filter) removes small oscillations from the signal. All turning points that correspond to the cycles with the ranges below the given threshold are removed. Higher the threshold, more turning points are filtered out, and vice versa. The rainflow filtering can significantly reduce the number of turning points, which can be of importance for both testing and numerical simulation. Threshold parameter of value T corresponds to the T% of the absolute load signal range.
Discretization filter
Discretization filter divides the range of a load signal into N equidistant bins and assigns each turning point to its closest bin. Load signals are typically very stochastic, therefore, discretization is often applied to make them flatter and less stochastic. The number of bins is adjusted with the Class count parameter.
Counting methods
Markov counting
Markov counting is one of the most straightforward cycle counting methods. It operates on consecutive pairs of turning points and calculates absolute ranges between them.
Rainflow counting
Rainflow counting is generally accepted as being the best cycle counting method up to date and has become the industrial de facto standard.
Rainflow counting uses ASTM E 1049-85 standard.
The idea behind the method is to detect the hysteresis loops in the load signal, as depicted in the figure below. We’ll refer to the hysteresis loops as the closed cycles. Parts of the signal that do not correspond to the closed cycles are the so-called open cycles or residuals. Simply said, closed cycles and residuals could be visualised as full-cycles and half-cycles, respectively.
Damage calculation
To calculate overall damage on the material, first check the box titled Accumulated damage. Then you need to define the correct S-N curve for your material in the S-N Curves tab.
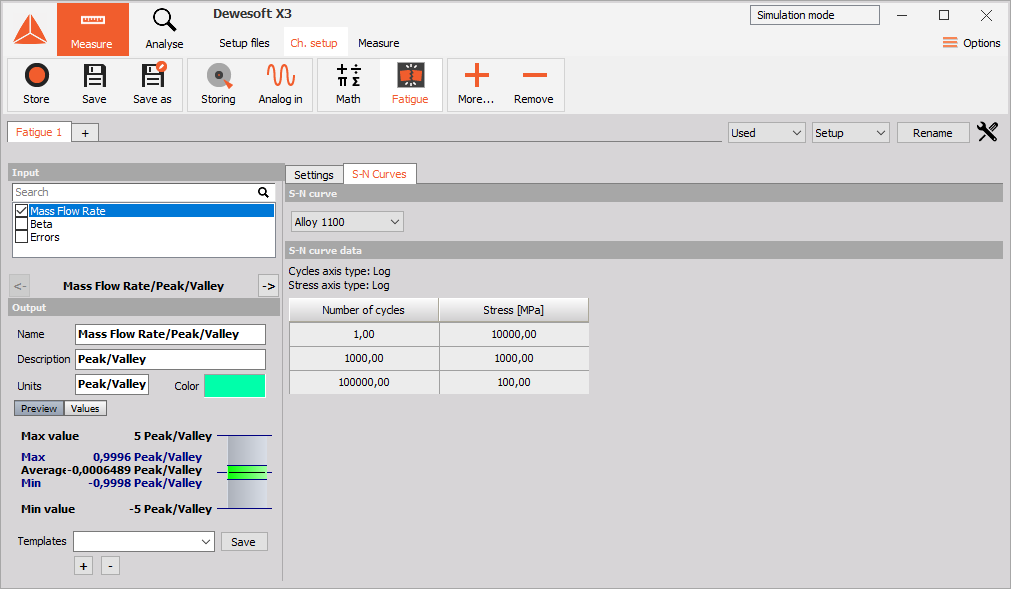
To add, delete or modify the S-N curve go to Options -> Editors -> S-N curves.
NOTE: Only the overall damage in the defined area of the S-N curve will be calculated. If your stress level or a number of cycles is outside of the predefined area, the damage will not be added to the overall damage.
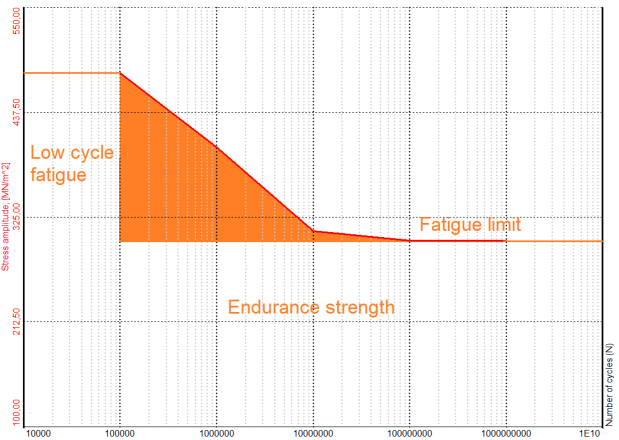
As seen from the image above for this specific S-N curve, only the damage calculated from the stress levels and cycle numbers inside the orange area will be added to the overall damage calculation.
Visualization
In order to graphically represent the results the Fatigue Analysis Module uses the most common visualization techniques used in fatigue analysis: range histograms, from/to matrices and range/mean matrices. When an input channel corresponding to a load signal of interest is selected, the following new channels are mounted:
- Preprocessing
- Peak/valley channel
- RF filter channel
- Discretization channel
- Rainflow counting
- Range histogram channel (2-D)
- Range/mean matrix channel (3-D)
- From/to matrix channel (3-D)
- Markov counting
- Range histogram channel (2-D)
- From/to matrix channel (3-D)
NOTE: The channels marked with 2-D and 3-D correspond to 2-D and 3-D graphs, respectively. The channels corresponding to the Preprocessing section represent intermediate fatigue analysis results and serve for information purposes only.
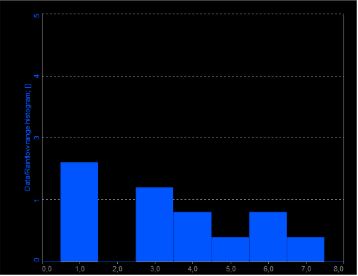
Range histogram
Range histogram is a 2-D graph representing the range distribution of a load signal. An example of a range histogram is depicted in the figure below. The X-axis and Y-axis of a range histogram correspond to the range and number of cycles, respectively.
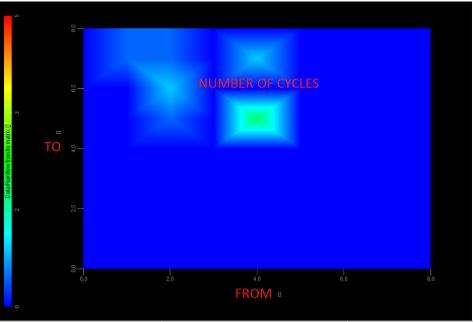
From/to matrix
From/to matrix is a 3-D graph representing the cycle distribution of a load signal. An example of a from/to matrix is depicted in the figure below. The X-axis, Y-axis and Z-axis of a from/to matrix correspond to From (cycle minimum), To (cycle maximum) and number of cycles, respectively.
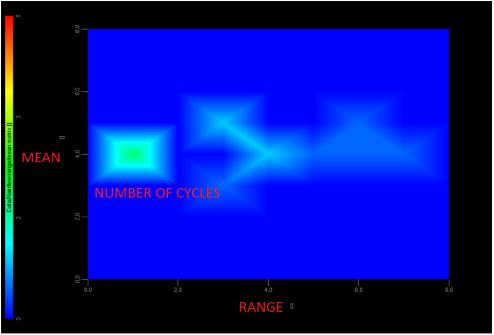
Range/mean matrix
Range/mean matrix is a 3-D graph representing the cycle distribution of a load signal. An example of a range/mean matrix is depicted in the figure below. The X-axis, Y-axis and Z-axis of a range/mean matrix correspond to cycle range, cycle mean and number of cycles, respectively.
Visualization settings
The visualization section is organized into three groups:
- Range,
- Mean,
- From/To.
Each group controls the appearance of the corresponding graphs. For instance, Range group controls the appearance of the range histograms and the range/mean matrices. Min range and Max range parameters specify the minimum and maximum of the range axis, whereas Classes parameter specifies the number of classes the range is divided into. When Auto check box is ticked DEWESoft automatically calculates Min range and Max range from the input signal. Exactly the same concept goes for the Mean and From/To groups as well.
For additional help visit Dewesoft PRO training -> Dewesoft Web page -> PRO Training -> Fatigue analysis.