Status Toolbar
The Status toolbar gives information regarding the setup and the system. It is located in the top right corner of the screen.
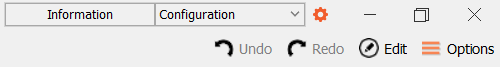
You can open the Status Manager to get more details by clicking the cogwheel icon.
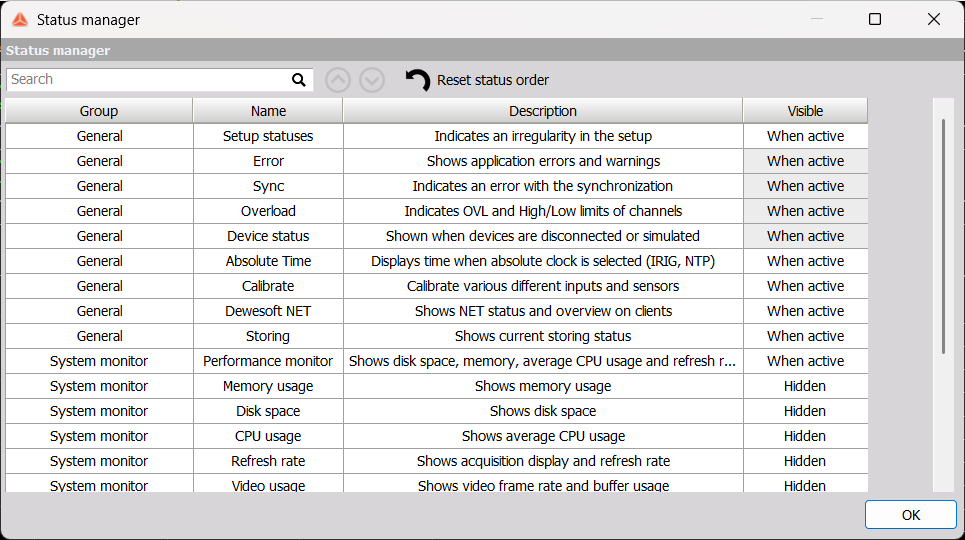
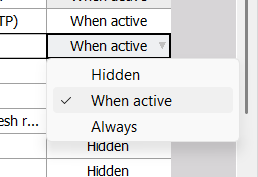
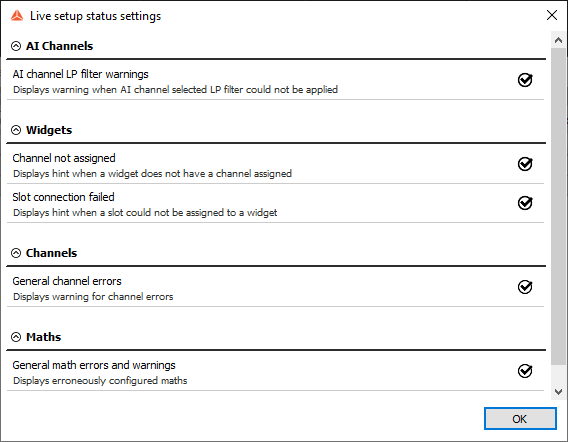
The Visible column indicates when the status will appear in the toolbar. Some status options are always present when active in the status toolbar and their visibility can’t be changed (greyed out box). Other statuses’ visibility can be changed to either Hidden or Always visible by clicking on the box.
There are three categories of statuses:
General Statuses
Live Setup statuses - Indicate an irregularity in the setup. For example, they would list inaccurately set parameters in the Math module.
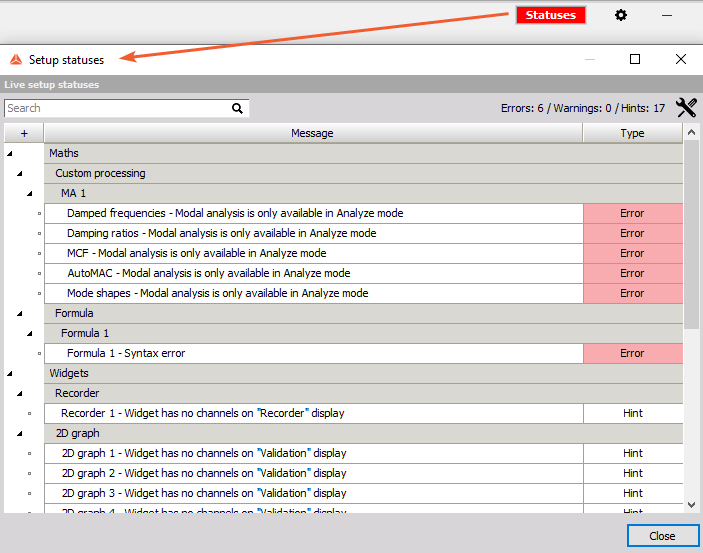
Error - Shows application errors and warnings. All notifications are listed in the Event viewer.
Sync - Errors that are related to synchronization, e.g. when the synchronization source is lost, a Sync lost error appears.
Overload/OVL - Indicates overloads and high or low limits of channels. When Critical limits are exceeded the notification will turn red, and if warning limits are exceeded the notification will turn yellow.
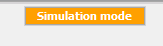
Device status - Shows when devices are disconnected or simulated. When you click on the button, you are redirected to hardware (HW) settings.
Absolute Time - Displays time when absolute clock is selected (IRIG, NTP).
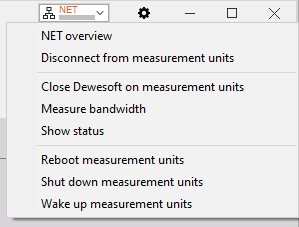
Net Overview - shows NET status and overview of clients. The button also offers other functionalites for the NET system, such as bandwidth meassurement, Disconnection form MU and others.
Storing - Shows current storing status - the notification will turn red when storing and will show the file size.
Alarm - Indicates when an alarm is triggered. It is possible to manually disable the alarm from this status notification.
Multiple instances - Displays the name of the secondary DewesoftX instance(s).
Current project name - Shows currently selected project file.
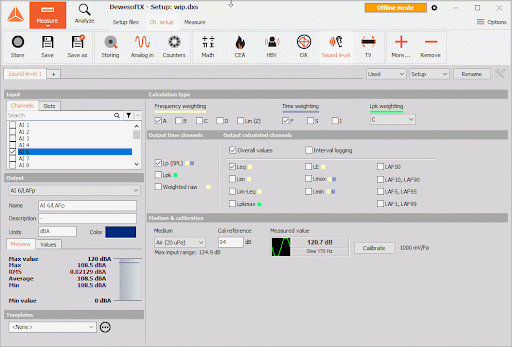
- Calibration - Offers (simultaneous) calibration functionality for Power, TV, CEA, HBV, SLM, Counters, OA, Angle sensor math, Microphone correction, and Resolver sensor math. To calibrate, select math modules and press Calibrate. Upon completion, the menu will contain statuses and calibration parameters. By pressing Revert, the calibration is reverted. Calibration can also be performed in Analysis mode on prerecorded data files. To do so, open a data file, zoom in on the valid part of the signal, and recalibrate the math by pressing Calibrate. To apply the recalibration to the rest of the data file, press Recalculate. The recalibrated parameters can be exported to a .dcf file and imported into different data files with the Import and Export buttons.
System Monitor
Disk space - shows disk space
Performance monitor - loops between Memory usage, Disk space, CPU usage, Refresh rate, Disk write buffer, and Video usage. If you do not want it to loop, click on it and select which status will be displayed permanently from the dropdown menu.
CPU usage - Average CPU usage.
Refresh rate - Acquisition update rate and display rate. Shows the size of the file when storing.
Video usage - Video frame rate and buffer usage.
Real-Time Controllers (RTCs)
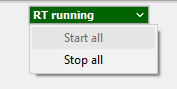
- RT status - Indicates if the device is operating in RT mode. This is an interactive button with which you can put the device in or out of RT mode. This status is only available when an RT device is connected (XHS, LX).