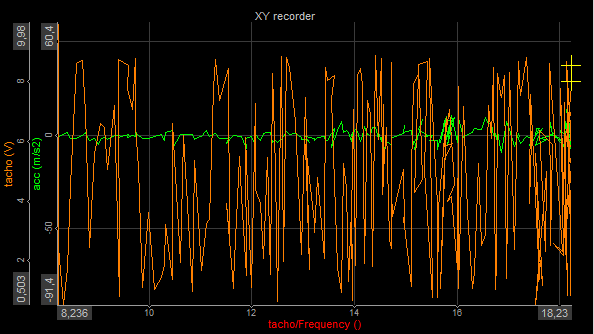
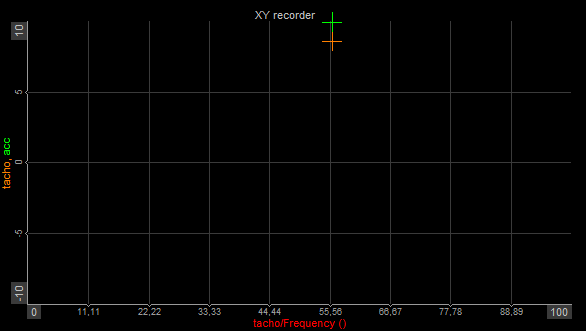
XY recorder 
The XY recorder displays channel(s)-channel(s) correlation, i.e. there is no direct time relation.
When you select the XY recorder widget, the following settings will appear in the Widget tab on the left part of the screen:
- XY recorder Control properties - applicable to all widgets, please refer to the linked page of the manual for more information
- X Axis
- Y Axis
- Drawing options
- Setup
- Cursor
The Channel selector will be to the right of the screen.
The yellow cross indicates the latest displayed value.
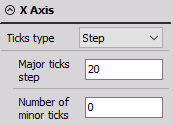
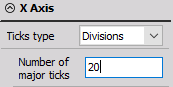
X and Y Axis
You can change the ticks type of the X and Y axis independently. Ticks are white lines that divide the graph area into sections. You can either choose how big a step between two major ticks will be (and the number of minor ticks between) or how many major ticks will appear on the graph, i.e. the number of divisions. By default, the ticks type is set to Automatic, meaning that Dewesoft will choose the appropriate scale.
You can also choose the Style of the Y axis:
- Default - each channel gets its own axis and scale
- Hidden - keeps the data appearance of the Default option, but hides the axes
- Single - all channels are on one single axis with one universal scale
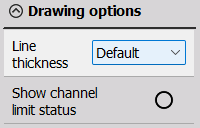
Drawing options
In this section, you can select:
- Line thickness - Change from default for better visualization.
- Show channel limit status - Show this status in the widget.
Setup
You can find the following options in the Setup tab:
Graph Type
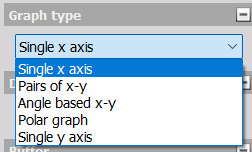
You can choose from five graph types:
- Single x-axis - Only one channel on the x-axis. The first assigned channel is assigned to the x-axis, the following channels are assigned to the y-axis (up to 16).
- Pairs of x-y - Allows defining multiple sets of x-y channels, i.e. pairing different y-axis channels with different x-axis channels. First select the x-axis channel, then select the y-axis channel and repeat for the following pairs. Be aware that you will have only one x- and y-scaling!
- Angle based x-y - The first x-axis channel is the reference channel for the angle. It can go from 0° to 360° or 720°. The second (and following channels) are angle related (for example rotational vibration). This XY recorder is like a Scope, but with an angle reference instead of a time reference.
- Polar graph - In a polar coordinate grid, there will be a series of circles extending out from the pole and different lines passing through the pole to represent the angles at which the known values of trigonometric functions are.
- Single y-axis - Allows only one channel on the y-axis. The first assigned channel is assigned to the y-axis, the following channels are assigned to the x-axis (up to 16).
Display Type
The XY graph can display Real data, Average (for slow signals), or RMS values (for dynamic signals). The values will be calculated over a period of 0.1 seconds.
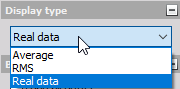
WARNING:Average and RMS display types represent only statistic values for the display. The settings have no influence on other displays or data storage.
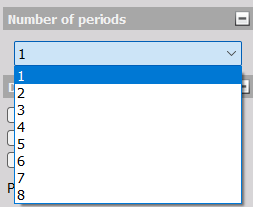
Angle based x-y graph - The Display type for this Graph type is different than others. You can display signals over 1 to 8 periods which can be selected from the dropdown list.
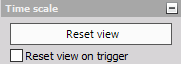
Time Scale
The classic Recorder and Scope displays show content for a limited time only, but you can decide for how long the XY recorder will show data. Simply click on the Reset view button in the Time scale section to clear the graph. You can also select to Reset view on trigger.
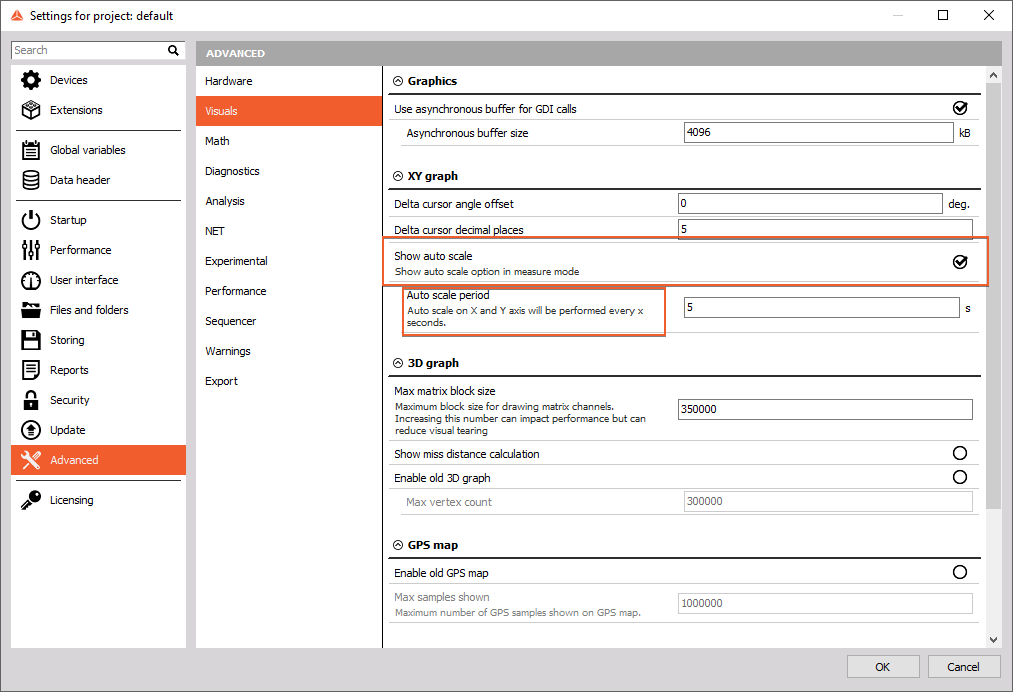
Auto Scale
You can auto scale the axes, but this option is disabled by default since it is CPU intensive. To enable it, go to Options - Settings - Advanced - Visuals - XY Graph. You can also set how often (in seconds) the auto scale will reset.
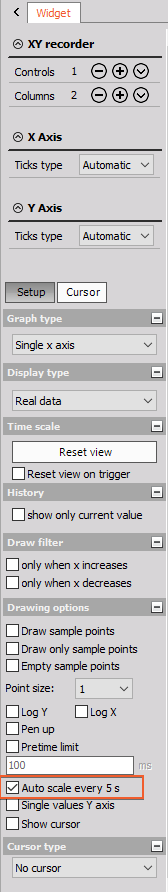
The Auto scale every _ s can then be turned on in Setup - Drawing options:
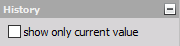
History
When the signal is changing severely, it may be helpful to click the show only current value checkbox in the History section; this removes all displayed values from the XY graph except for the current value. Unselect this feature to receive the whole signal history again.
Example:
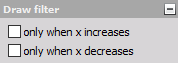
Draw Filter
For run-up tests, you should use the only when x increases checkbox in the Draw filter section. This is a drawing filter and avoids any values which are smaller than the one before. Unselect this feature to receive decreasing X-axis signals again.
Inversely, you can also select only when x decreases to see decreasing values only.
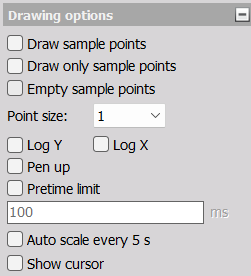
Setup Drawing Options
If you wish, you can Draw (only) sample points and Empty them. You can also select point size. Drawing only sample points means that you will not see interpolated curves.
You can also convert the X and/or Y axis to logarithmic axis types if needed for your application.
The Pen up option will prevent the XY Recorder from erasing data lines when switching display screens or temporarily stopping measurement.
The Pretime limit will determine how many miliseconds of data are stored before a trigger event occurs.
If you enable Show cursor, a yellow cursor will appear on the current data sample point.
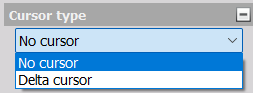
Cursor Type
If you want Dewesoft to calculate the difference between two sample points, select Delta cursor from this dropdown menu.
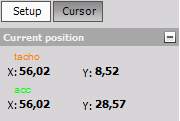
XY Recorder Cursor
By selecting the Cursor tab, the cursor readouts for each Y channel in the current position are displayed.