Recorder 
The Recorder widget is designed to show time-history like a traditional strip chart recorder, but with enhanced display and analysis capabilities. For the Recorder Display Type, please follow the provided link.
When you select the Recorder widget, the following settings will appear:
- Recorder Control properties - applicable to all widgets, please consult the linked section of the manual.
- X Axis (Time)
- Y Axis (Value)
- Drawing options
- Channel selector - on the right
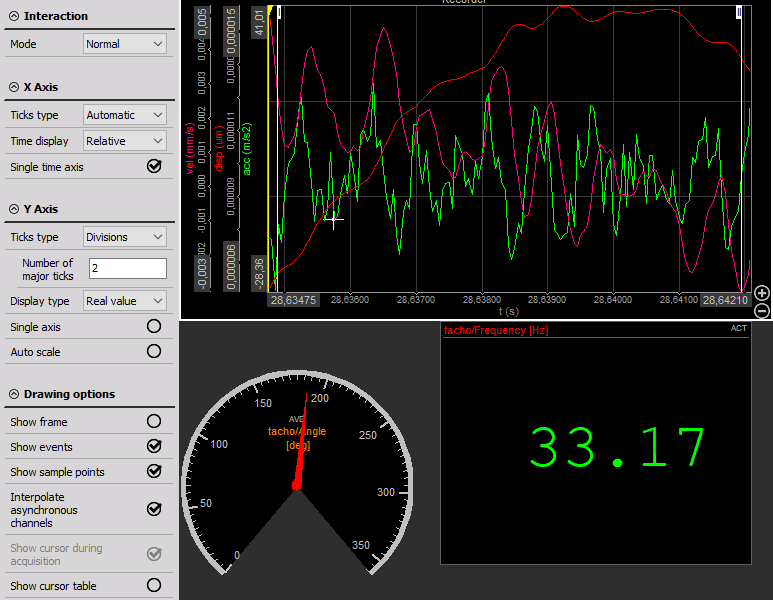
X Axis (Time)
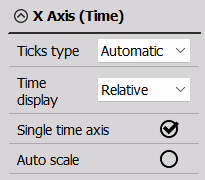
The following settings are available:
- Ticks type (Graph Settings) - Modify the graph grid. These settings apply to both axes and are independent from each other.
- Time display (Graph Settings) - Change the way time is displayed according to your needs.
- Single time axis (Graph settings) - Assigns a separate time axis to each channel if unchecked.
- Auto scale - Generally, auto scale automatically adjusts the min. and max. values according to the signal. In this case, you will see the entire recording since start of measurement (min. = start, max. = current time).
Y Axis (Value)
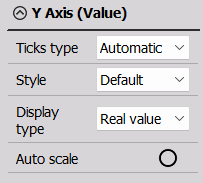
The following settings are available:
- Ticks type (Graph Settings) - Modify the graph grid. These settings apply to both axes and are independent from each other.
- Style - Choose how the y-axis channel, units, and values will be displayed.
- Default - all information shown
- Hidden - all information hidden
- Single - all channels and units shown together
- Compact - channel, units, min. and max. values shown
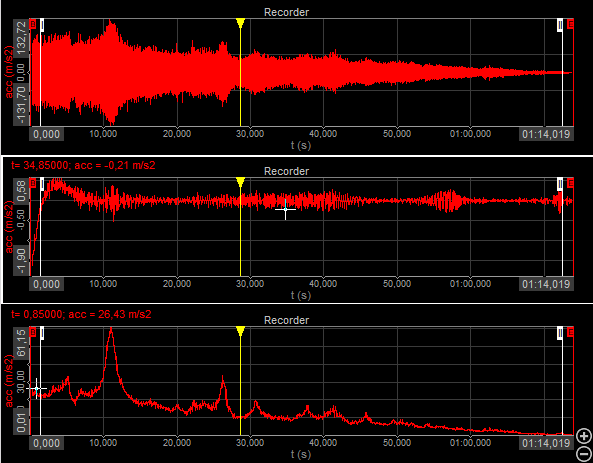
- Display Type - Set the data presentation status.
- Real value
- Average - For noisy DC signals, selecting Average can clean up the display.
- RMS - Useful when monitoring AC signals which are going to look like a solid band when a long duration is shown.
- Max
- Min
- Auto scale - Automatically adjusts the min. and max. values to according the signal.
WARNING: Be aware that the display types represent only the statistic values for the online display. The settings have no influence on the other displays or the data storage.
Example - display types:
Drawing Options
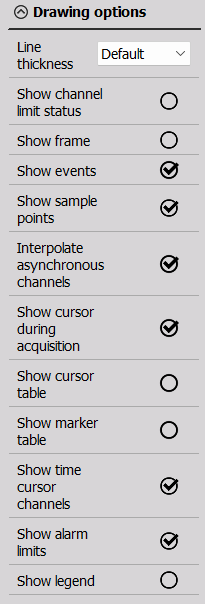
The following drawing options will help you further customize Recorder appearance:
- Line thickness
- Show channel limit status
- Show frame - white frame around the widget
- Show events - show or hide marked events
- Show sample points - display individual sample points in Analyze mode
- Interpolate asynchronous channels - If an asynchronous data source like CAN is used, the values are interpolated between two sample points, but for digital signals this is unwanted. Disable interpolation and the value will stay at the same level until the next value is available.
- Show cursor during acquisition - a white plus sign appears on the signal when moving the mouse to the Recorder
- Show cursor table - all cursors in one table
- Show marker table - places a Marker table widget
- Show time cursor channels
- Show alarm limits
- Show legend - places a Legend widget
Improve Visualization
When the time area is really long, the recorder stats drawing data from the intermediate buffer, which changes the signal visualization as only min. and max. values are shown.
To improve signal visualization, please take a look at the following solution.