Horizontal / Vertical Bar 

The horizontal and vertical bars give a graphical indication of the current value of a signal within the defined display range.
When you select a horizontal or a vertical bar in Design or Run mode, control properties will appear to the left and right of the screen. For detailed information about control properties: grouping, number of columns, add/remove widgets, transparency,… see Control properties.
Horizontal / Vertical Bar Settings
Typical settings (for both Horizontal and Vertical bar) are:
- Display type ->Graph settings
- Meter type
- Average time -> Graph settings
- Upper / Lower limit -> Graph settings
- Minimum / Maximum shown value -> Graph settings
- Channel selector
For detailed information about assigning channels, see Display settings.
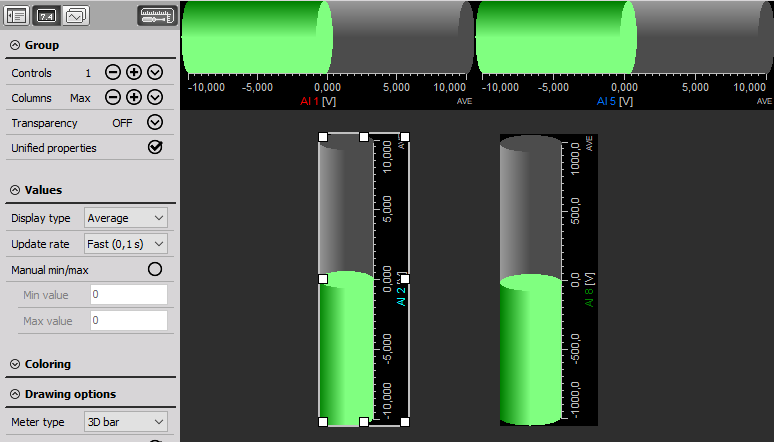
Meter type & Appearance on Screen
The orientation of the bar graph (horizontal/vertical) depends on the selected widget, changing the orientation is not possible afterwards.
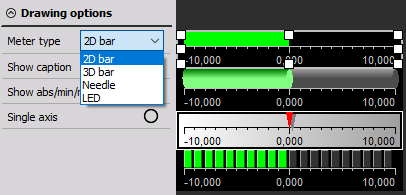
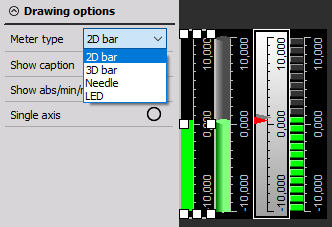
No matter the orientation, there are four different types: 2D bar, 3D bar, Needle, LED. They can be selected from the Meter Type dropdown list in Drawing options.
They all contain the channel name, display type and unit beside the measurement values.
For detailed information about widget positioning, size and transparency, see Widget appearance.