Power Statistics
IEC 61400-21-1 - Wind turbines
The standard IEC 61400-21-1 relates to measurements of electrical characteristics of wind energy generation systems.
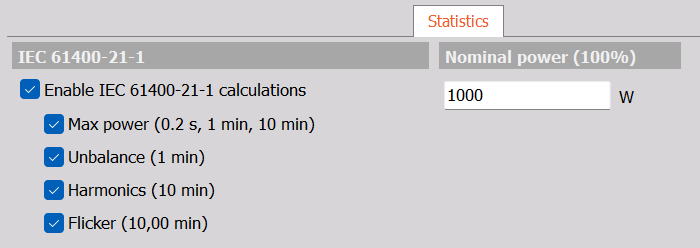
According to IEC 61400-21-1 a series of calculated electrical quantities must be ordered in a list of power bins, and determined over certain time intervals. The power bins are ranged from 0 % to 100 % with an interval of 10 %. 100 % relates to the user-defined Nominal power.
NOTE:
In order to measure these Wind power statistical quantities the following settings must apply:
- The power configuration must be a three phase system
- Cycles symmetrical components must be enabled under the Power quality tab
Specifically for Harmonics, all harmonics needs to be enabled under Power quality
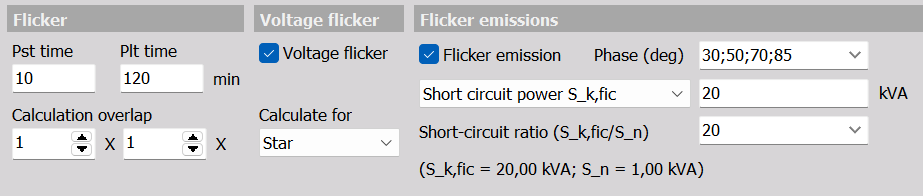
Specifically for Flicker, Voltage Flicker and Flicker Emission must be enabled under Power quality
Max power
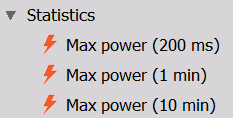
Enabling Max power will provide three channels that contain the maximum detected power within intervals of:
- 200 ms - Maximum 200 ms average power (positive sequence system component).
- 1 min - Maximum 1-minute average power (positive sequence system component).
- 10 min - Maximum 10-minute average power (positive sequence system component).
The three channels give metric values that can be displayed in Measure mode using Digital Meter widgets.

After selecting a Digital Meter widget the three Max power channels can be selected in the channel list under Power - Statistics:
Unbalance
Unbalance is calculated in 1 min intervals and provides unbalance channels having values for each power bin, for the following quantities:
- P (Unbalance) - Active power positive sequence system component. Mean over 1-minute averages per power bin.
- U_p (Unbalance) - Voltage positive sequence system component. Mean over 1-minute averages per power bin.
- U_n (Unbalance) - Voltage negative sequence system component. Mean over 1-minute averages per power bin.
- I_p (Unbalance) - Current positive sequence system component. Mean over 1-minute averages per power bin.
- I_n (Unbalance) - Current negative sequence system component. Mean over 1-minute averages per power bin.
- u_i (Unbalance) - Current unbalance factor. Mean over 1-minute averages per power bin.
All Unbalance channels gives vector values across the Power bins, and they can be displayed in Measure mode using a 2D/3D table widget:
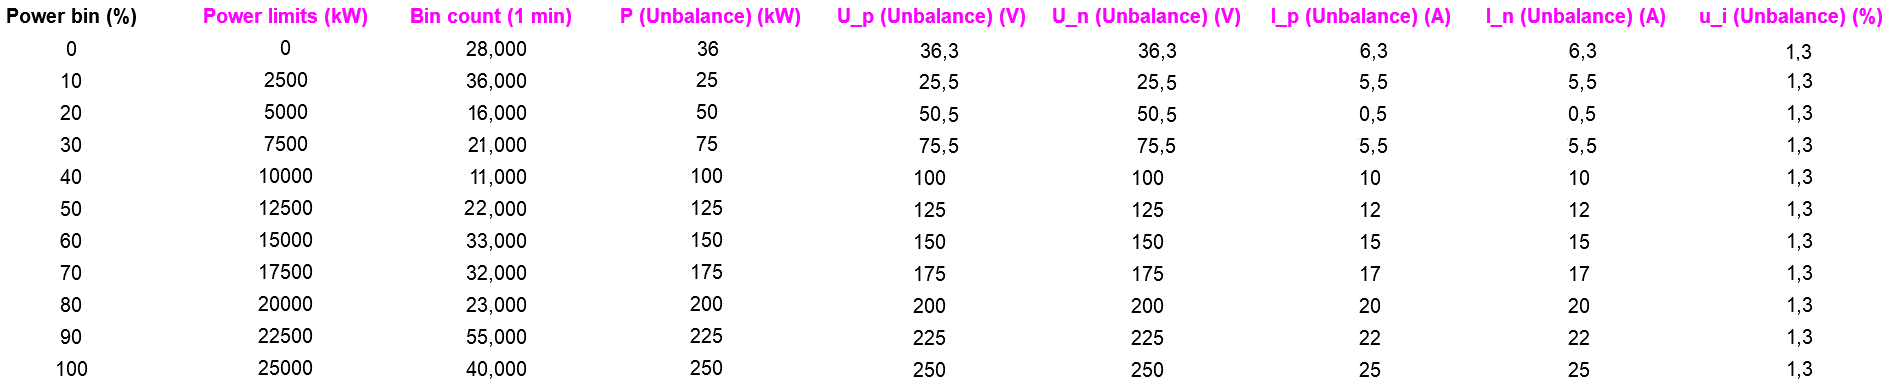
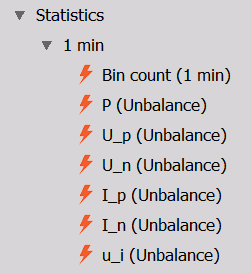
After selecting a 2D/3D table widget the all Unbalance channels can be selected in the channel list under Power - Statistics:
In addition the Bin count channel and the Power limits channel can also be added to the table widget to improve the investigation, as shown in the table above.
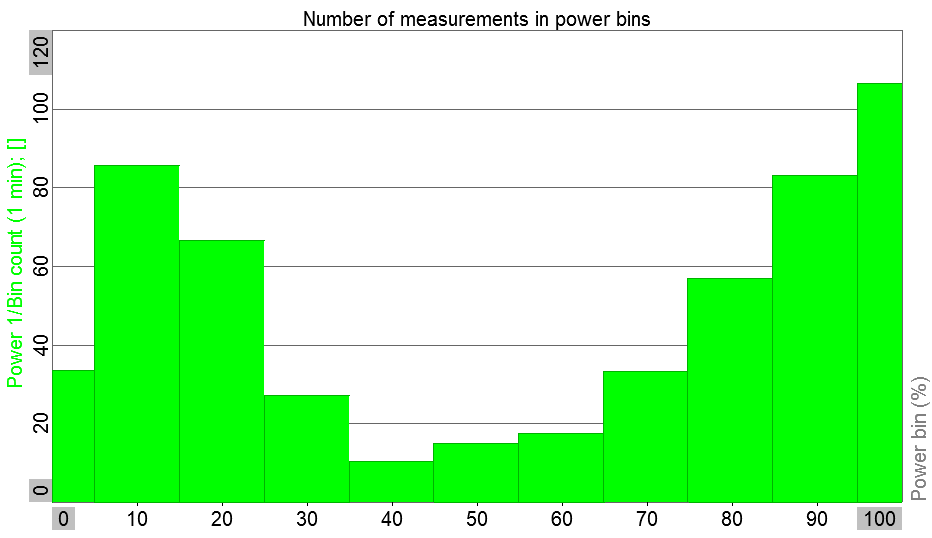
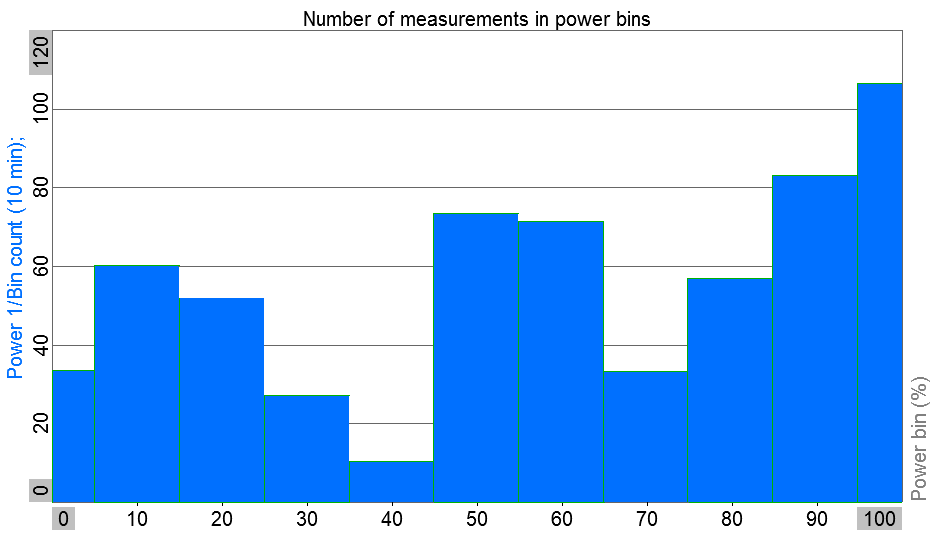
The Number of measurements in power bins can also be visualized as a bar graph on a 2D graph widget as shown below.
Harmonics
The 95% percentile of the harmonics are calculated over 10 min intervals and provides such harmonic percentile values for each power bin, in channels for the following quantities:
- U Harmonics - 95th percentile of 10-min harmonic voltages per power bin.
- I Harmonics - 95th percentile of 10-min harmonic currents per power bin.
- I Interharmonics - 95th percentile of 10-min interharmonic currents per power bin.
All Harmonic and Interharmonic channels gives matrix values both across all harmonics and across the Power bins, and they can be displayed in Measure mode using a 2D/3D table widget as shown below:
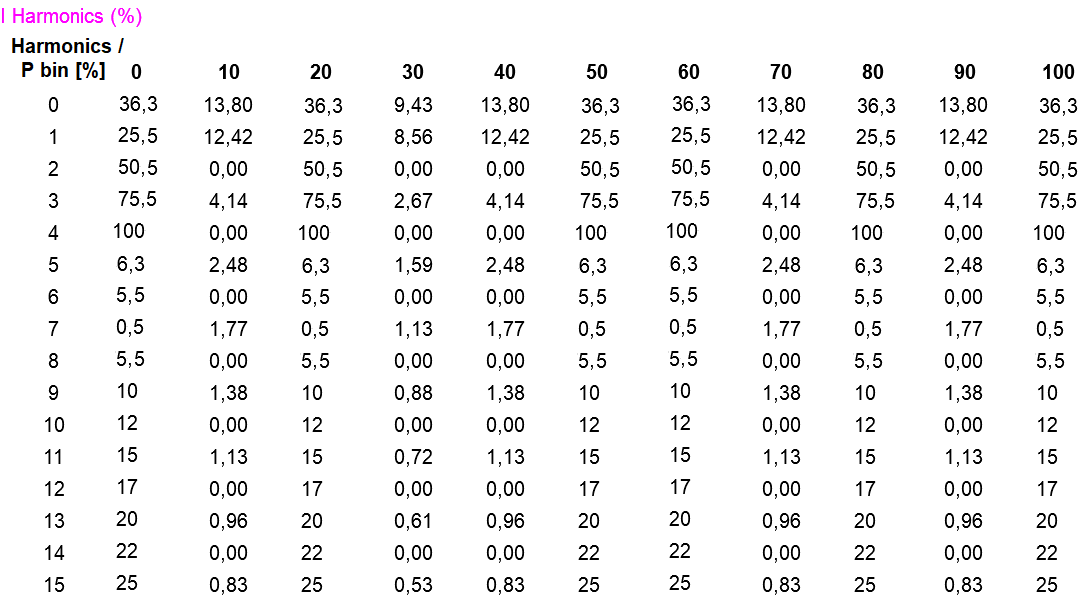
Only one harmonic unbalance channel can be selected for each 2D/3D table widget since each channel is a matrix across all harmonics and power bins.
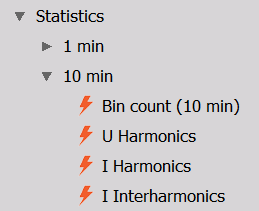
After selecting a 2D/3D table widget the one of the Unbalance channels can be selected in the channel list under Power - Statistics:
Similar to the 1 min bin count bar graph for Unbalance values, the 10 min power bin count for the Harmonics and Flicker calculations can be visualized on a 2D graph to inspect the data amount at the individual power bins better, as shown below:
Flicker
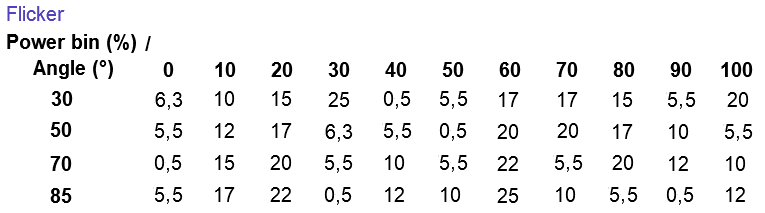
By enabling Flicker under the Statistics tab you get the 95th percentile of flicker coefficients as a function of the impedance angle for all power bins, calculated over a 10 min interval.
The Flicker metrics follows Flicker calculations in accordance to IEC 61000-4-15, and are configured under the Power quality tab as shown below:
After enabling Flicker under the Statistics tab you can then select the statistical flicker channel in Measure mode and use a 2D/3D table to inspect all values together:
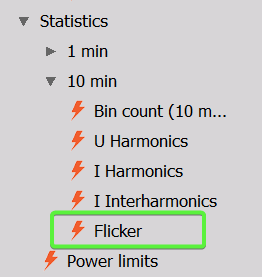
The flicker channel to select is located under the 10 mins channel group: