Spreadsheet
Our new spreadsheet widget is designed for presentation and organization of data, particularly for data reports.
You can display data in cells arranged in rows and columns, with the flexibility to format text using various font styles, sizes, colors and alignments, or simply copy text from other editors such as Excel. The background color of each cell can be customized, and cells can also be merged for better presentation. You can also customize spreadsheet borders and its colors. Additionally, the data ordering option in columns is available for ease of use. All those functionalities are easily accessable on the tolbar that is shown, as soon as you are focused on any cell in the whole widget.
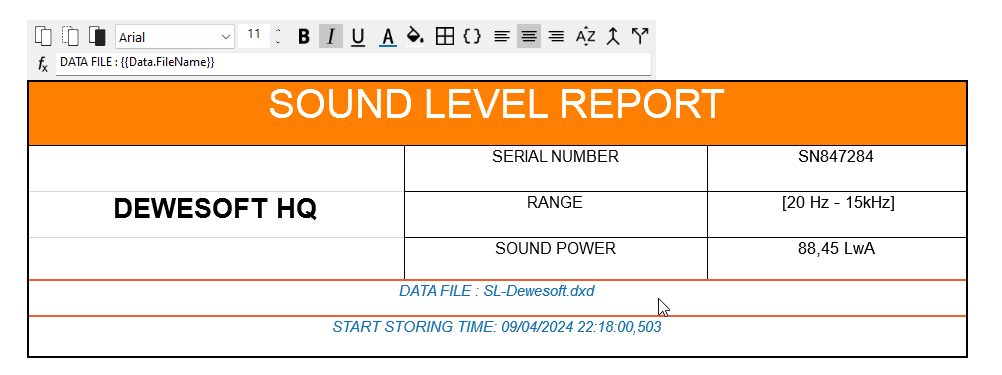
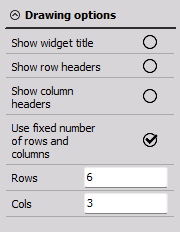
Additionally you can enable to draw the column, row or widget titles in widget settingson the left pannel. The widget title can be changed, by pressing on it inside the widget. Once you add the column and row titles you can also easily manipulate the position of the inside borders of cells.
Here you can also customize the number of columns and rows. By default the cells are fixed to the complete size of the spreadsheet widget. But you can also choose that the size is not adjusted to its size, by disabling the “Use fixed numbers and columns” option.
Expressions
Spreadsheet widgets offer a simplified process by allowing users to select predefined expressions directly from the drop down list in its editor (the symbol for expressions is { } ) . These expressions include options for presenting channel data and setup or data file properties. For a complete list and description of these expressions, follow the following link.
