Displaying data
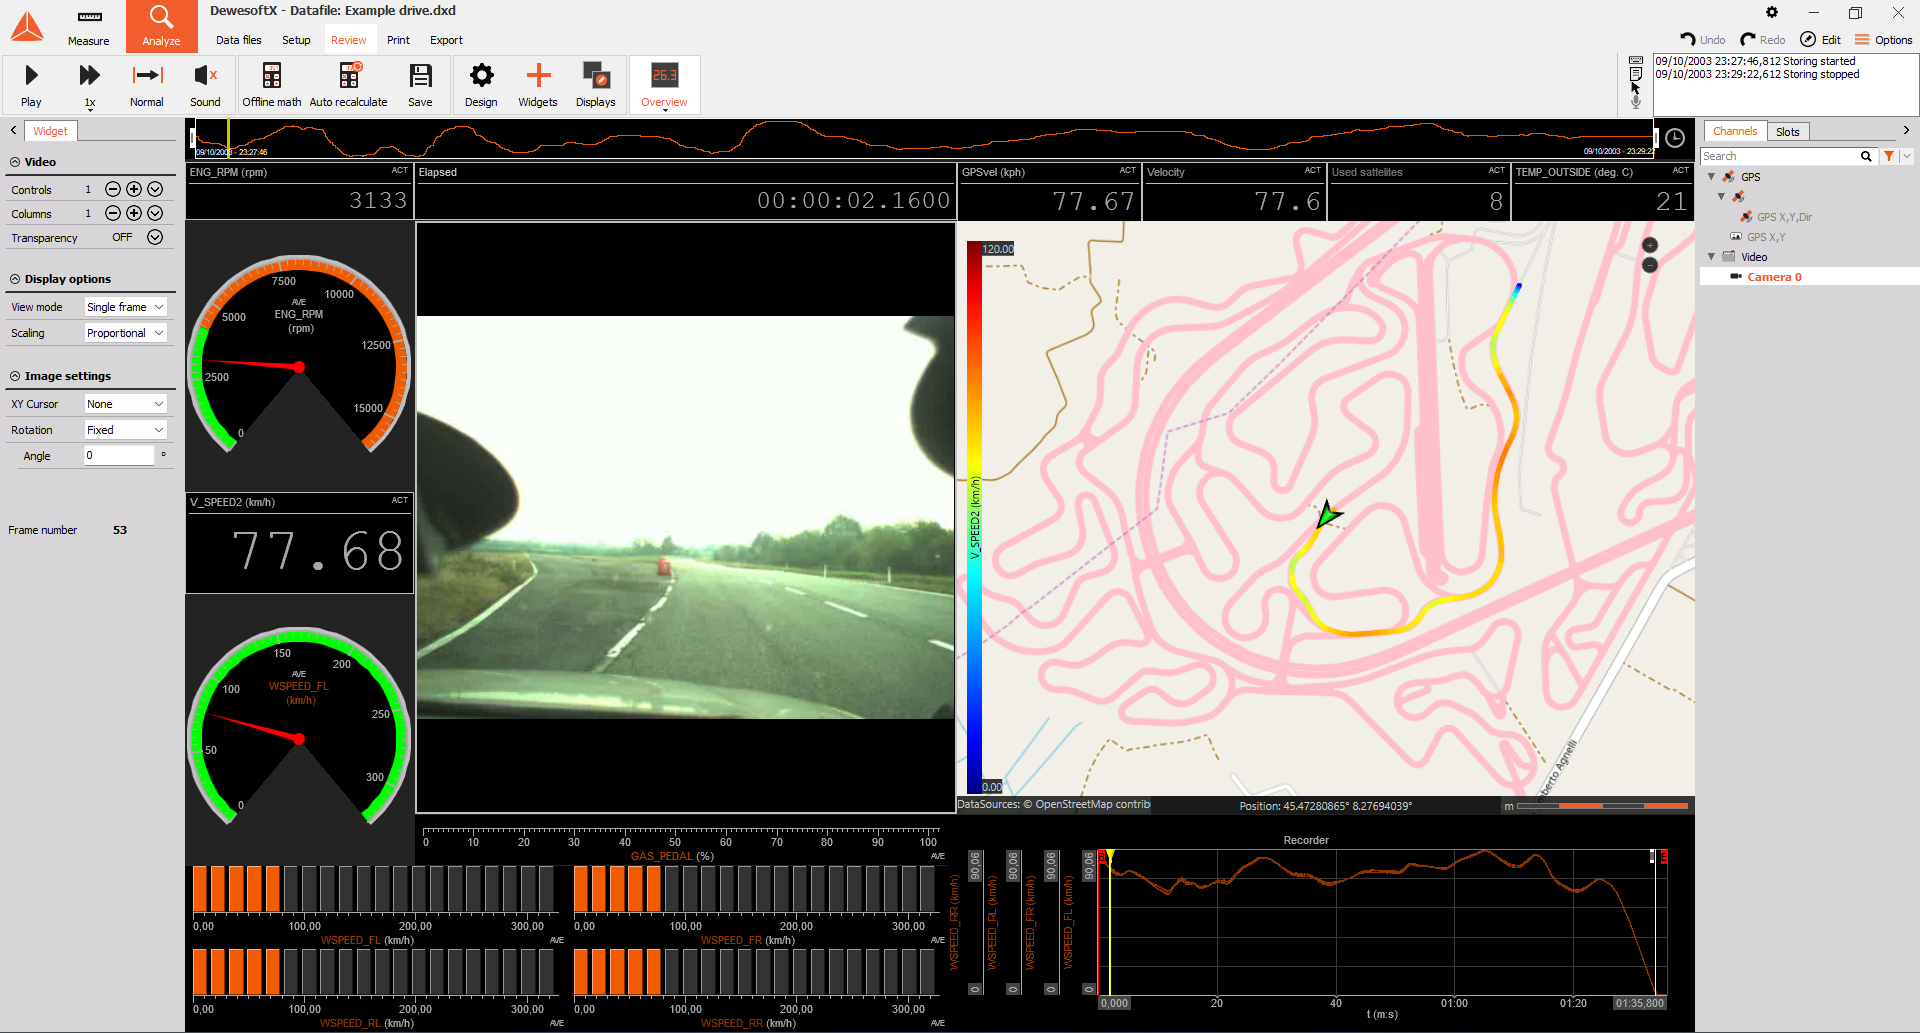
As soon as you have reloaded the measurement file in Dewesoft Analyse mode, the recorded data will be displayed. Independent from the selected instrument type, there are several elements which are the same for all instruments.
On the top of display screen is a Overview widget with one channel asigned. Here you can see the the whole measurement with possibility to customly select a channel for overview widget and option to adjust the zoomed-in region by adjusting the size of the Time overview box using mouse wheel, time overview box left and right handles or Time selector.
Let’s take as an example the Overview screen:
NOTE: All section of this chapter refers to the file Example_Drive01.dxd, that is atomatically included with standard installation of DewesoftX. You can load this file to try out the described functions.
All of the channel scaling, name, and units info that were in effect at the time of recording are restored so that your data can be properly interpreted.
The display settings can be done in Measure and Analyze mode. You can use in Analyze mode all of the features available in the Measure mode: to add/delete widgets and inputs from each of them, change the presented values of X-axis and Y-axis , and more. If we alter the display settings in the Analyse mode we need to manually store those settings with choosing Data -> Save file changes (or press store button). To use the altered settings for next measurement setup you can use Data -> Use setup for the measure.
For information about Store settings see -> User Guide -> Storing settings and events.
The interesting area for us is now the top area of the screen. You will see several elements which are not available in the Measure mode. Let’s go into detail now.
Overview Widget
Each instrument offers at the top of the screen a small bar with one channel as an overview of the whole measurement:

Stored data offers at the top of the screen a small bar - overview widget / Time overview bar with:
- Simple overview widget with one customly assigned channel in white rectangular bordered with Left and Right handle. The handles can be used to adjust the focused or zoomed area on time-domain widgets (time overview box). The zoom-in/zoom-out option can also be achived by scrolling the mouse wheel, while focused on the simple overview widget.
- Yellow cursor shows the location of currently focused data
- Start date and time of stored data
- End date and time of stored data
- Time selector
Select a channel for Overview Widget
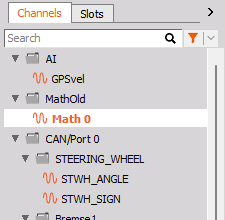
Click on the overview bar to select it. Now you can change the displayed channel on the overview widget. As per default the first acquired channel is assigned. To change the channel, simply select it from the channel selector - the same way as assgning channel to any other display widgets.
For information about Channels selector see -> Channel selector.
Zoomed Region Selector
Partly selected range of stored data is marked on the Overviw widget as additional window - Zoomed Region selector. Symbolic display of signals outside of this box is dimmed.
We can select another zommed area on the Overview widget by adjusting the Zoomed region selector. You can easily adjust its size and position in different ways:
- Enter a new start and end time in Time selector or directly on the Recorder widget
- Click on the Selector or on the overview widget and move it by mouse
- Simply use theleft and right key on the keyboard (this will move the selection window each time by the half size of the window itself)
- Change the position of the left and right handle of the Zoomed Region Selector
- Use mouse wheel when you are focused on the Overview widget

When your storing contain triggers a trigger icon will appear on the left side of the Overview widget. Once you click on the Trigger icon, you will be automatically swithced to the triggered area. Additional arrows will appear, to give you a quick access to switch between multiple triggered area.

Within the Zoomed Region selector there is also a yellow cursor, which is showing the current position in data as all yellow cursors on any other widgets available. With mouse pointed on yellow cursor you can also change the position of it.
Time Selector
Click Time selector icon on the right side of the overview bar, the following Time selector window will pop-up on Analyse screen below Time overview bar:
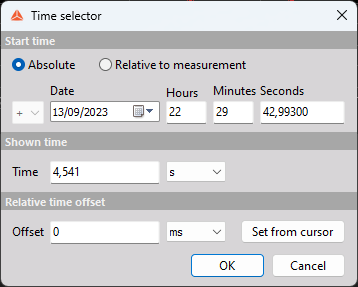
Now you can enter:
- Exact Start time position within the file:
- Absolute - in left field date is displayed, which can be selected from the drop-down list (calendar is displayed); in right fields you can define start time in form of h:mm:sec
- Relative to measurement - the user enter start time information in relative time display - days, hours, minutes and seconds can be adjusted. In relative time format, the start of the acquicitions starts at zero.
The result depends on the used screen instrument: the single value elements like digital or analog meter, bargraph,… will show the current values the beginning of the selected time window, multiple value elements like the recorder, scope, FFT,… will display the signal only within the selected zoomed area.