FFT Analyzer
For more information:
The FFT analyzer manual can be found here.
An FFT guide article can be found here.
When you select the FFT analyser, the following setup window will open:

FFT settings are divided into 3 sections:
- Basic (spectrum format, windowing, resolution setting, averaging mode, ..)
- Advanced (freq. weighitng, crosspower spectrum, derivation/integration, PSD, …)
- Scalars (output RMS, peak, interpolated harmonics, THD)
Basic
Output spectra
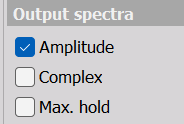
- Amplitude - output is the amplitude of the signal, in input units
- Complex - outputs are phase, imaginary and real part of the signal.
- Max. hold - option creates an additional channel, which contains maximum hold lines values across time for all individual lines. This checkbox is grayed out when Overall Maximum avearing is selected since then this additional channel is a duplicate.
Amplitude format
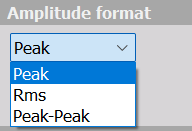
The Amplitude format display section defines display in Y-amplitude axis.
In Amplitude type we can choose from:
- Peak - is the pure signal amplitude [V].
- RMS - is the RMS amplitude, calculated as Amplitude/sqrt(2) [V].
- Peak-peak - is the signals peak-peak amplitude [V].
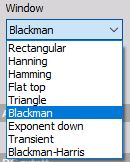
Window function
Window - Rectangular, Hanning, Hamming, Flat Top, Triangle, Blackman, Exponent down, Transient, Blackman-Harris and Kaiser-Bessel.
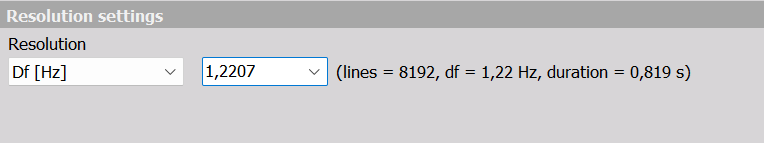
Resolution settings
Resolution - resulution of the spectrum can defined in the number of Lines, Delta frequency Df [Hz] or with Block duration [s].
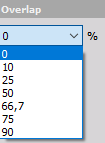
Overlap
Overlap defines the percentage of time signal that has already been calculated and it is used again for calculation (example: 50% overlapping means that the calculation will take half of the old data).
Averaging
Under the Averaging section first you have to specify how much data that should be averaged together by the Mode property:
- No averaging - each spectrum is outputted without averaging, for each defined time block of data, one FFT spectrum is calculated
- Block based - user can define number of blocks that can be averaged together to calculate one FFT spectrum
- Overall (Averaged) - gives only one averaged FFT spectrum at the end of the measurement. It will average all the blocks in the signal and the output will be only one FFT for the whole measurement.
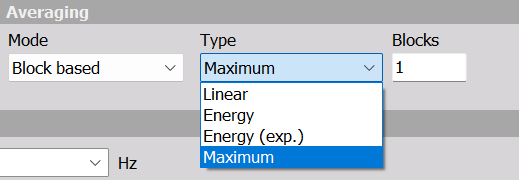
When Block based or Overall FFT is selected, there are 4 different averaging Types available:
- Linear average - linear average calculates the arithmetic mean of all the values. Linear average gives the same weight to each amplitude value in the average. Note: this averaging type should only be used in special cases.
- Energy average The energy average is the default average type for stationary measurements. The energy average calculates the averages of the squared values of all values. For this reason, sometimes the term RMS (root mean square) average is used.
- Energy exp. average The energy exponential averages the values and weights the acquisitions taken later in time more heavily than the earlier acquisitions.
- Maximum - maximum value average takes the maximum value at the spectral line. Often this is referred to as peak hold averaging. The maximum value average is useful for measuring the worst case vibration.
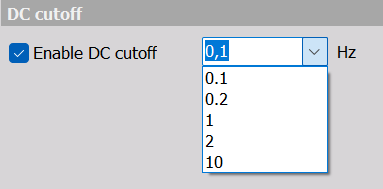
DC cutoff
To remove DC or low-frequency components, select from a drop-down list the DC cutoff filter - lower limit.
For more information on how the DC spectral line is calculated please see the section DC line calculation.
Advanced
Amplitude function
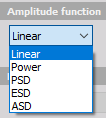
In Amplitude function we can choose from:
- Linear - is the pure signal amplitude [V].
- Power - calculated as RMS value squared [V*V] (also known as AutoPower)
- PSD - Power Spectral Density, takes the Power divided by the frequency resolution (including the time window Noise Bandwidth, NBW). Used for random noise signals [V*V/Hz].
- ESD - Energy Spectral Density, takes the PSD integrated over the spectral averaging time. Used for energy exposure analysis.
- ASD - Amplitude Spectral Density, or Linear Spectral Density (LSD), takes the square root of PSD. Used for the same things as PSD, but relates to a similar unit as the channel input unit.
Amplitude function has no effect on the complex spectrum. Only the amplitude is scaled to the complex spectrum according to the format amplitude setting (RMS, peak, peak-peak).
Amplitude function only affects the amplitude spectrum. Linear means that the amplitude of the spectrum is expressed in the same units as the input signal.
It is calculated as the absolute value of the complex spectrum, which, like the complex spectrum, is additionally scaled according to the format amplitude setting. Unlike the complex spectrum, the amplitude spectrum can also be averaged over the entire measurement or at intervals with ordinary or energy averages.
Amplitude spectrum has no phase information but only the complex does.
Frequency weighting
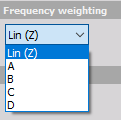
As a standard, FFT analyser uses Linear Weighting. For sound analysis, special FFT weighting can be set. As opposed to the sound module in math, where the weightings will be calculated in the time domain, this will calculate the sound weighting in the frequency domain. Weighting can be of the following type:
- Linear weighting - is linear at all frequencies and it has the same effect on all measured values.
- A weighting - is applied to instrument-measured sound levels in an effort to account for the relative loudness perceived by the human ear, as the ear is less sensitive to low audio frequencies.
- B weighting - is used for intermediate levels and is similar to A, except for the fact that low-frequency attenuation is a lot less extreme though still significant (-10 dB at 60 Hz). This is the best weighting to use for music listening purposes.
- C weighting - is similar to A and B as far as the high frequencies are concerned. In the low-frequency range, it hardly provides attenuation. This weighting is used for high-level noise.
- D weighting - was specifically designed for use when measuring high-level aircraft noise. The large peak in the D-weighting curve is not a feature of the equal-loudness contours but reflects the fact that humans hear random noise differently from pure tones, an effect that is particularly pronounced around 6 kHz.
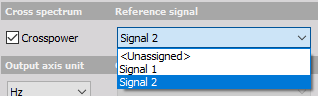
Cross spectrum
Cross-spectrum is used as part of a frequency domain analysis of the cross-correlation between two time series. Crossspectrum is used for calculation of power cross-spectrum, phase spectrum and coherence spectrum.
Output quantity and output unit
Frequency integration/derivation (double derivation/doble integration) is possible direclty in the FFT analyser. If the input quantity is acceleration and we select output quantity as dispacement, the FFT analyser will preform double integration in frequency domain.
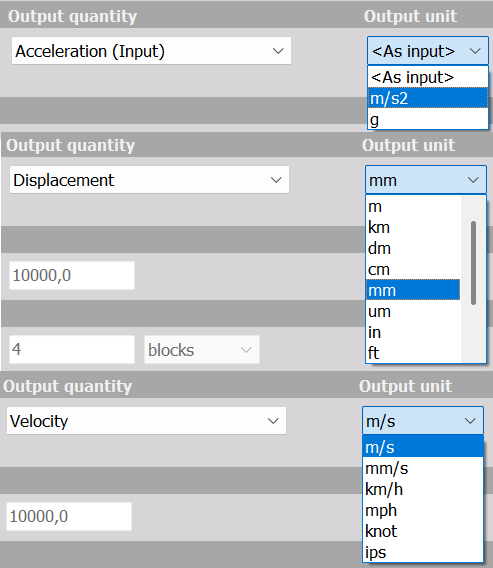
The frequnecy unit can be selected from:
- Hz
- rpm - the X axis will have RPM units ([Hz] * 60).
- cpm - the X axis will have cpm units (counts per minute [Hz * 60]).
Frequency range
Limited range can be enabled if the used frequency range should be reduced to a fraction of the original range that is based on the acquisition sample rate.
This can be useful if the input channels are acquired with a much greater sample rate than relevant for the specific FFT analysis.
Such channels might have been acquired with higher sample rates due to other types of analysis that are performed in parallel to this FFT analysis.
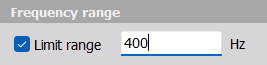
Limited range settings are also used for Full range Scalar outputs.
Output control
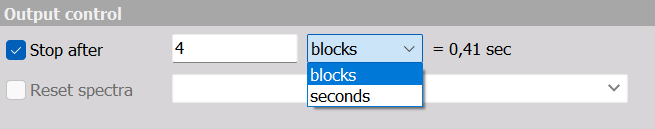
Stop calculation
With Stop after function you can acquire only a selected number of blocks (or seconds) of data. When the condition is reached, the FFT spectrum will stop updating.
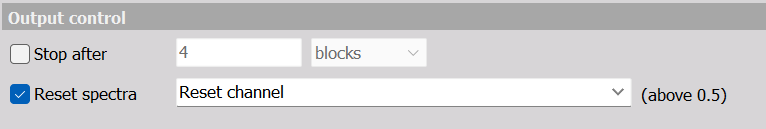
Reset spectra
NOTE: This option is enabled only if you select Max. hold spectrum in Output spectra settings.
Users can use a control channel (or any other channel, the hardcoded trigger limit is set to 0.5) to reset the maximum hold spectrum with a click on the button (or when the trigger event happens) during the measurement.
Scalars
Overall output scalars
Output scalars will output overall rms values similar to RMS markers. The overall rms values can have the amplitude format set to both RMS, Peak, and Peak-Peak by toggling the Output scalars checkboxes:
- RMS - Directly outputs the overall RMS values over time
- Peak - Outputs overall values scaled to peak = sqrt(2) * RMS
- Peak-Peak - Outputs overall values scaled to pkpk = 2 * Peak
For more information about how the overall rms values are calculated please see the section RMS calculation.
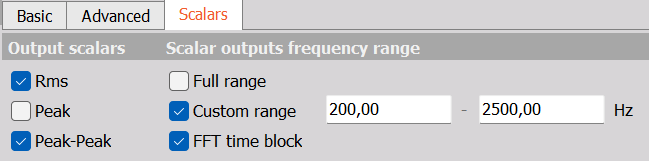
Each overall scalar channel will output a value for each FFT spectrum. The values will be based on the selected Scalar output frequency range:
- Full range (up to the Nyquist frequency) - will calculate the total rms value across all FFT spectral lines. If Limited range is enabled then only FFT lines up to that frequency limit will be included in the calculation.
- Custom range - will calculate the overall rms value based on FFT spectral lines included in the specified custom range. If Limited range is enabled then that also sets an upper limit for the defined Custom range.
- FFT time block - will calculate Peak and Peak-Peak values directly based on time samples values from the FFT time blocks, instead of being based on the FFT spectrum values.
NOTE:
Full range outputs will only contain data up to the set Limited range frequency value, when Limited range is enabled.
Also note that, the Full- and Custom range Peak and Peak-Peak scalars are determined from the RMS over the range and then peak and peak-peak scaled.
For determining maximum values in spectra please use Max markers, Max. hold spectra, or maximum averaged outputs.
RMS calculation
The FFT Analyzer RMS value and RMS marker values are based on the AC RMS together with the DC RMS.
The AC RMS is determined by the energy-sum of all included lines in the defined range, except the DC line, divided by the Noise BandWidth of the used Window.
The DC RMS is determined as described in the section DC line calculation.
The RMS value is independent of the spectrum related Amplitude format.
Harmonics
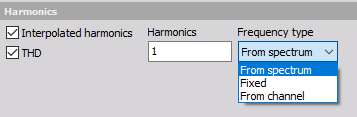
- Interpolated harmonics - Let you output a vector with specific harmonic components of interest.
- THD - Total Harmonic Distortion is a useful technique to analyze any non‑linear behavior of a system.
The FFT Analyzer - THD output includes all harmonic components below Nyquist in the calculation, except those harmonic components that are non-distinguishable from the noise floor.
Both the Interpolated harmonics and the THD calculations use Peak interpolation.
Harmonics
With the Harmonics field you can write which Interpolated harmonic components you want extracted. Each harmonic is separated with a semicolon. For example if you want no 2, 3.5, and 6.25, then you write: 2; 3,5; 6,25.
Frequency type
The Frequency type defines how the first harmonic is determined. It can be: From spectrum, Fixed frequency or From channel.
NOTE: If the Frequency type is set to From spectrum, then it is assumed that the first harmonic contains the max peak value in the spectrum.
Search range
DewesoftX 2025.3 version of the software, 1.0.0, implemented a Search range under the Harmonics section.
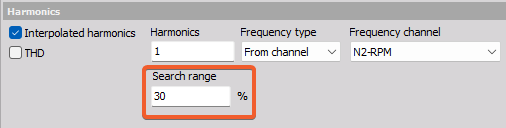
This search range is a percentage (to the left and right) of the frequency at which the Interpolated harmonic is set to. The way it works is that we first calculate the position of the Interpolated harmonic, and then the software looks for the most accurate value of the component in the search range we specify.
Example:
- If the harmonic is at 100 Hz and the Search range is set to 30%, we will look for the component between 70Hz and 130 Hz.
FFT markers
2D graph can display values of the currently selected point with the crosshair cursor. When clicking on such point with the left mouse button, the marker line will be added showing x axis value on the x-axis and showing y-axis vale of a certain point above the marked point. All points can be removed by pressing the right mouse button and select Delete selected marker.
For detailed information about FFT markers see -> 2D Graph.
For additional help visit Dewesoft PRO training -> Dewesoft Web page -> PRO Training -> FFT markers.
For detailed information about FFT Analysis see -> FFT Analysis.
FFT on asynchronous data
Frequency analysis can be done also on asynchronous input data in the Dewesoft FFT analyzer. When you select an asynchronous channel as the input, all the synchronous are locked out in the same instance.
You can even select multiple async signals in the same interface, as long as they have the same time base. There is no resampling done async data when doing frequency analysis.
FFT analyzer recognizes asynchronous data and assumes the samples are equidistant and that the async rate is set properly (the distance between the samples is determined by the rate on channels).
If the data are coming randomly, the signal is not appropriate for analysis.
FFT on vector data
Frequency analysis can also be performed on vector channel data, where blocks of time (vector) data is inputted with an asynchronous rate.
Triggered FFT using Scope math
Performing FFT analysis on vector input data can be a great benefit if FFT spectra based on specific time intervals are required.
Such specific time intervals can be gathered as vector data using the Scope math module.
When output vector data from Scope math is selected as Input for the FFT Analyzer, then the Frequency resolution is automatically fixed based on the input vector size and used sample rate.
DC line calculation
In order to calculate the DC component correctly for the FFT spectrum, it is calculated separately and then added to the spectrum.
The DC spectral line is determined from the average of all time samples included in the used FFT time block.
The remaining spectrum is calculated using the FFT process, but on the FFT time block where the calculated DC value has been subtracted.
Finally, the calculated DC line is added to that FFT spectrum.
NOTE: Based on the definition of DC, the Amplitude format - Peak will give the same DC value as when the format is set to RMS. The Amplitude format - Peak-Peak will give a zero-value DC.