vizualization
Velodyne LIDAR module outputs can be clearly vizualized on Dewesoft’s Map widget.
Map widget is vizualization tool that can preview 2D and 3D data of selected channels with right positioning on the Earth’s surface. There are a few options of previewing map by different layers, such as Street maps, Statellite maps, Solid colour, …
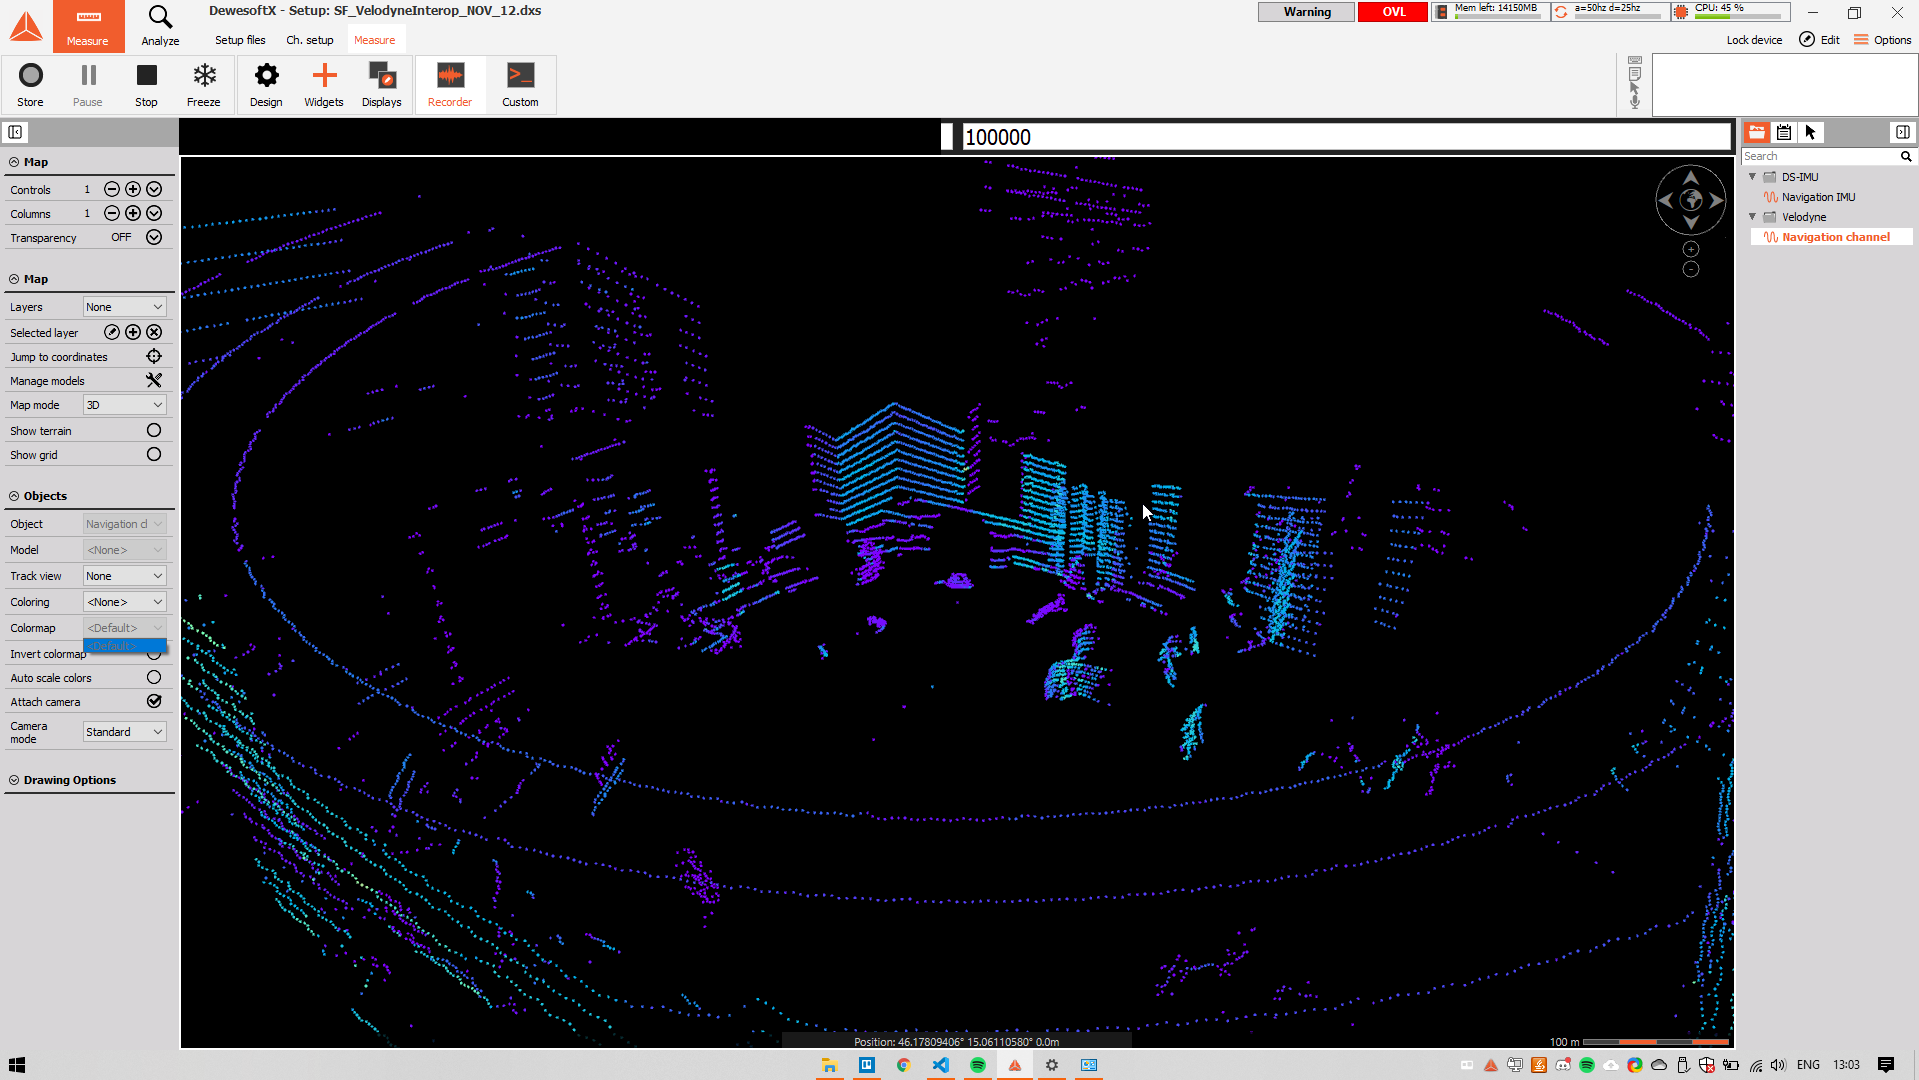
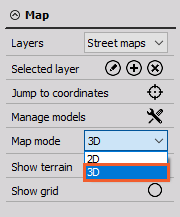
On the Map widget you can preview 3D vizialization of Velodyne LIDAR data. In order to preview LIDAR data, it is needed to select 3D vizualization on the left side of the map widget user interface.
3D models
Predefined or custom 3D models of the vehicle for example, can be added in their real size scaling. This option gives a clear view of where the vehicle was moving, what environment surrounded it, and what were the distances between the vehicle object and surrounding area or items of interest.
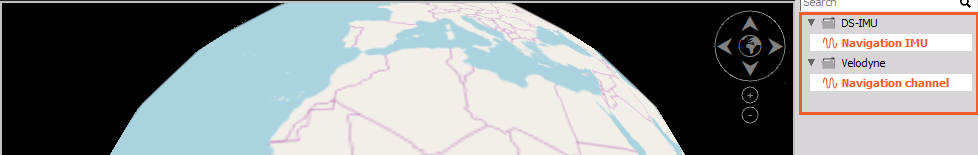
3D models can be previewed for navigational channels of GNSS devices only. That’s why it is required to apply multiple channels (navigational channel of GNSS, and navigational channel of LIDAR) on the Map widget:
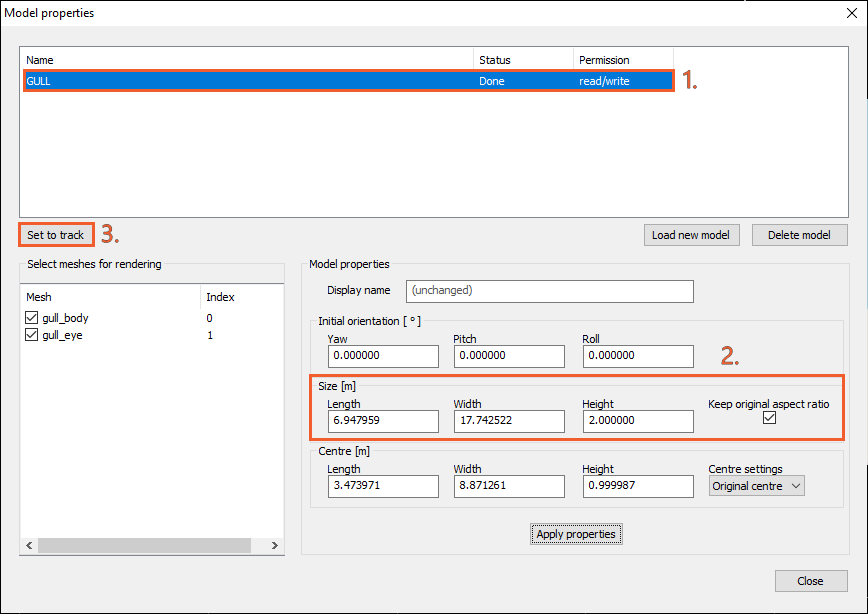
Now it is able to manage and add 3D models to the Map widget. First by Managing models, it is needed to select or add a 3D model:
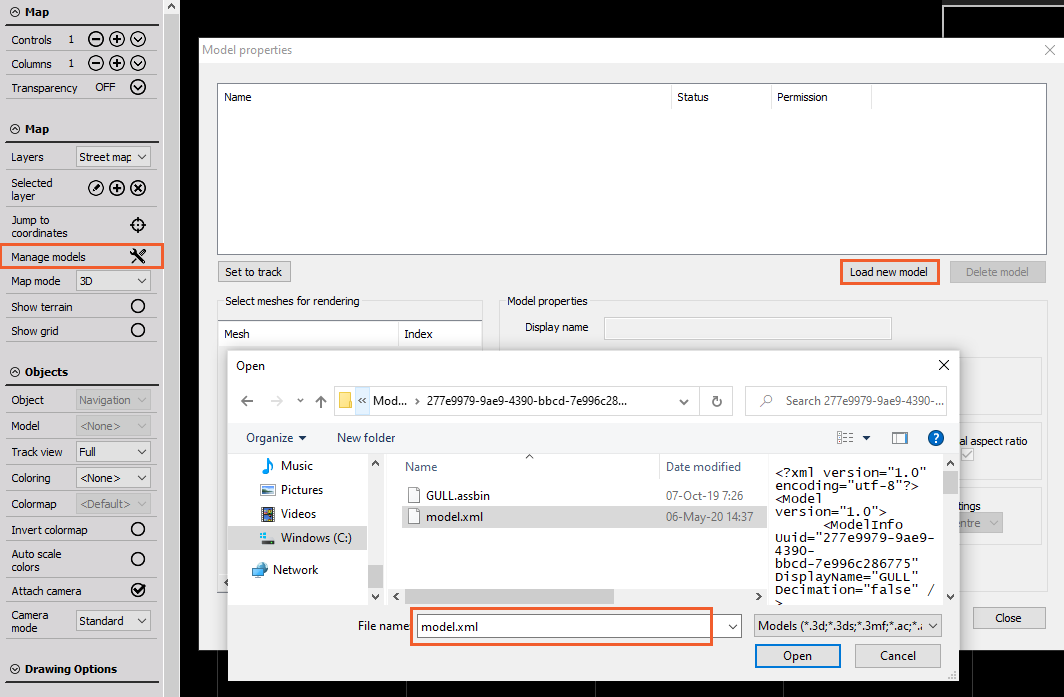
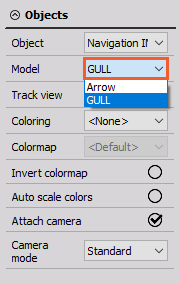
Imported 3D model, has to be Set to track and choosen under Objects section -> Model, for GNSS navigational channel.
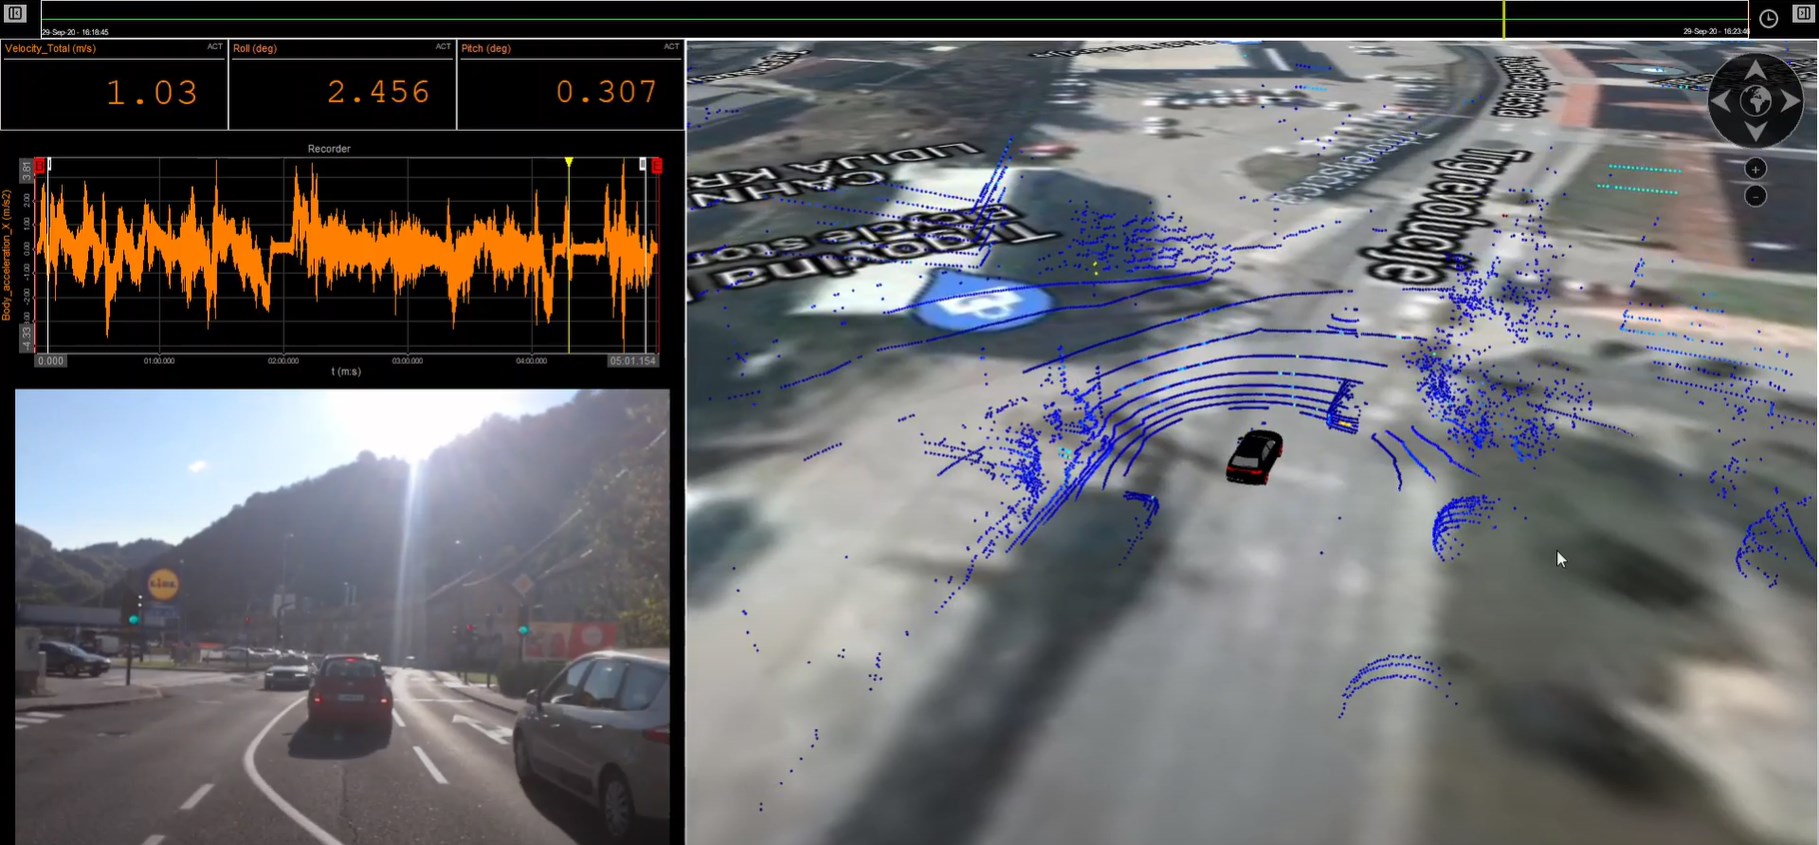
Vizualization - 3D model together with LIDAR data on Map widget:
The following shortcuts can be used on the Map widget for LIDAR points data:
| Shortcuts | Description |
|---|---|
| CTRL+ALT+A | Change colouring on the next |
| CTRL+ALT+S | Change colouring on the previous |
| CTRL+ALT+Q | Invert colours |