Live Data Preview
The bottom left section of the menu shows a live preview of your signal. There are three tabs, i.e. three ways live data is displayed:
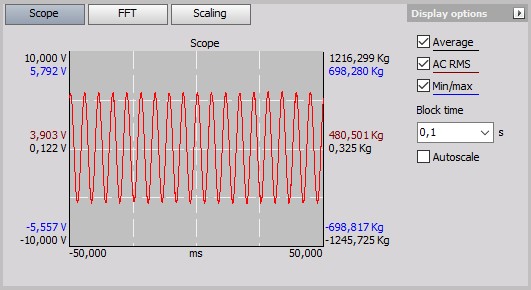
Scope
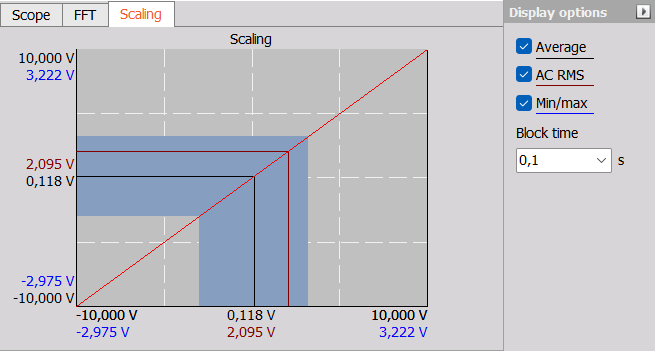
- the left side are the electrical units, and the right side are the scaled physical units, so you can directly see the effect of your scaled (and calibration) values:
Depending on the pressed button(s) in this area, different Input and Scaled values are represented on the dynamic graph:
- on the left side the “electrical” units
- on the right side is the scaled “engineering” units
That way you can directly observe the effect of your calibration values.
You can also change Block time (defines time for calculation) for signal display.
If you have an AC signal source, you should press the red-labeled AC RMS button to add the RMS values to the dynamic display.
Calculation Time (Block Time)
On this section on the graph, you can change calculation time (Block time) and signal display frequencies of the selected values. Predefined choices are:
- 0.1 second
- 1 second.
Dynamic Signal Representation
- The graph shows the current input signal. In addition, the min/max, AC RMS and average values are displayed. If the input signal is higher than the selected input range, you will see a message OVL in this screen.
- The values at the left side of the bar graph show the “electrical input” value, representing the input range of the amplifier. The right side shows the “physical input” value of the scaling, so you can directly see the effect of your calibration values. In this example, they have to be the same.
- Use the Average, AC RMS and Min/Max button to show or hide the values.
- Change the calculation time (Block size) between 0.1 and 1 sec to achieve the best view for your signal.
FFT
Scaling