Counting
When you press the Setup button or open a new math Counting line, the following setup window will open:
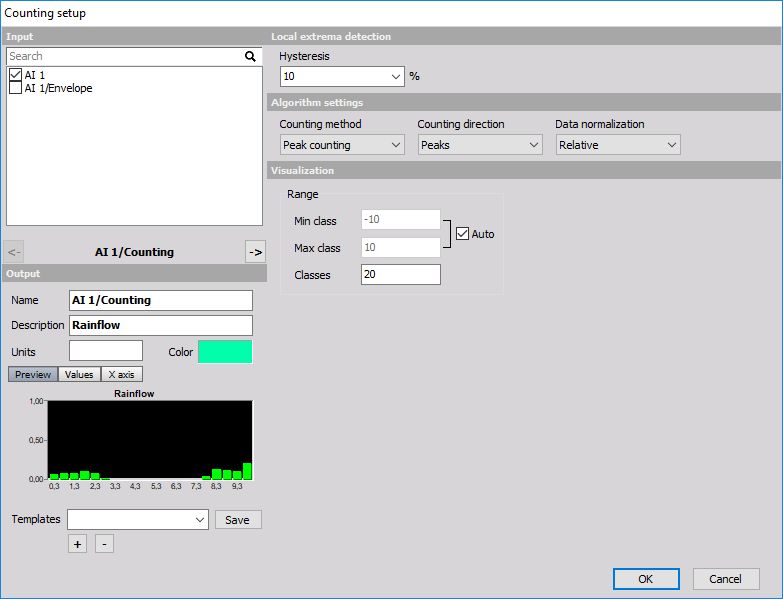
Counting is the standard procedure to reduce the amount of data for analysis. It is for example used in the application of road load data collection where we have some static load and on top dynamic load.
The only interesting values are the height of load cycles and the average static load of that cycle. For that purpose, the rain-flow analysis is made.
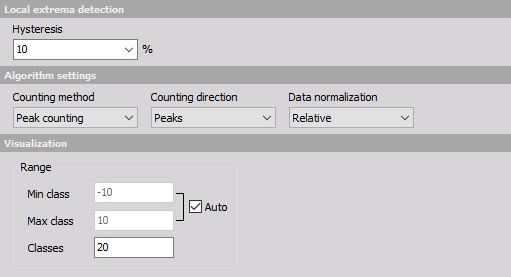
The counting procedure counts the peaks and valley of the signal. The Hysteresis is defined in the percentage of the class width. This prevents too many false counts if the signal is noisy.
There are three possible output values (Normalization):
- Absolute - it outputs the number of cycles as a value - values will increase with time.
- Relative - it outputs the number of cycles normalized to the absolute number of cycles - the sum of all values will be always 1.
- Relative [%] - it outputs the number of cycles normalized to the absolute number of cycles multiplied with 100 - the sum of all values will be always 100.
There are several Counting Method to choose from:
- Peak counting - counts the number of peaks in the signal in certain classes (for this option we can define to count peaks, valleys or both).
- Range counting - counts the range between successive peaks and valley pairs. Ranges are positive when the slope between peaks and valleys is positive. We can choose either to count positive, negative directions or both).
- Level crossing - counts the number of times when that signal crosses various levels.
First, four options output 2D matrix while the last one outputs 3D matrix.
For all options we have to define the number of classes for Average value, minimum - Min and the maximum - Max or we choose to define the Min, max value from the range of input parameters.
For 2D rainflow we have to define these parameters also for the third axis which counts Peak-peak value.
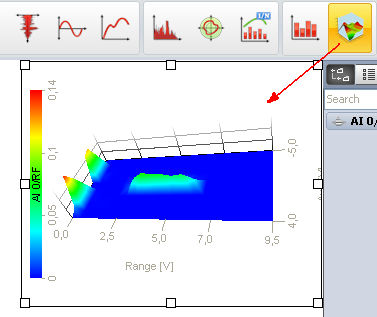
The peak, range, level and 1D rainflow can be best seen in 2D graph while we need to use 3D graph for rainflow.