PCB Strain Rate
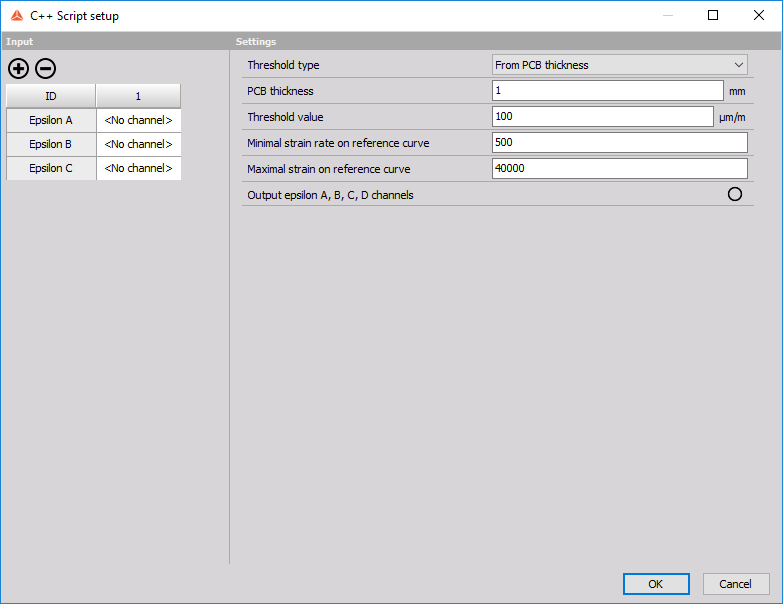
This C++ Script calculates PCB strain rate according to IPC/JEDEC-9704A. After importing the script the following setup should appear:
For general information about the C++ Script see -> C++ script.
Input
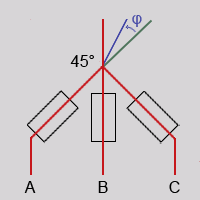
Define the input channel for A, B and C rosette.
This script uses the 45° rosette as seen on the picture below.
Settings
Threshold type:
- From PCB thickness - the threshold values are calculated automatically from PCB thickness.
- From threshold value - use the inputted threshold value.
PCB Thickness:
- define the thickness of the PCB. Only used if the threshold type is “From PCB thickness”.
Threshold value:
- define the threshold value. Only used if threshold type is “From threshold value”.
Minimal strain rate on reference curve:
- x-coordinate of the minimal strain rate outputted on the reference curve. Only used for visual representation of the threshold.
Maximal strain rate on reference curve:
- x-coordinate of the maximal strain rate outputted on the reference curve. Only used for visual representation of the threshold.
Output epsilon A, B, C, D channels:
- enable or disable output of epsilon A, B, C, D channels.
Output
The script outputs the following channels. They are organized in groups for a better overview. Epsilon outputs
- Epsilon A
- Epsilon B
- Epsilon C
- Epsilon D
Principal strain outputs - strain calculated in real time
- Maximum principal strain
- Minimum principal strain
- Diagonal strain
Principal strain rate outputs - strain rate calculated in real time
- Maximum principal strain rate
- Minimum principle strain rate
Maximum strain and strain rate outputs - the biggest value of max/min strain or strain rate compared by its absolute values
- Maximum strain
- Maximum strain rate
Absolute maximum outputs - absolute value of the maximum strain and maximum strain rate
- Absolute maximum strain
- Absolute maximum strain rate
Overall strain outputs - max/min strain value over time
- Overall maximum strain
- Overall minimum strain
Overall strain rate outputs - max/min strain rate value over time
- Overall maximum strain rate
- Overall minimum strain rate
Exceeds threshold output
- Ovl
Reference curve outputs - used for visual representation of threshold on XY Recorder
- Reference curve x
- Reference curve y
Nearest point outputs - strain and the strain rate nearest in value to the threshold
- Nearest strain rate to threshold
- Nearest strain to threshold
Example of the output:
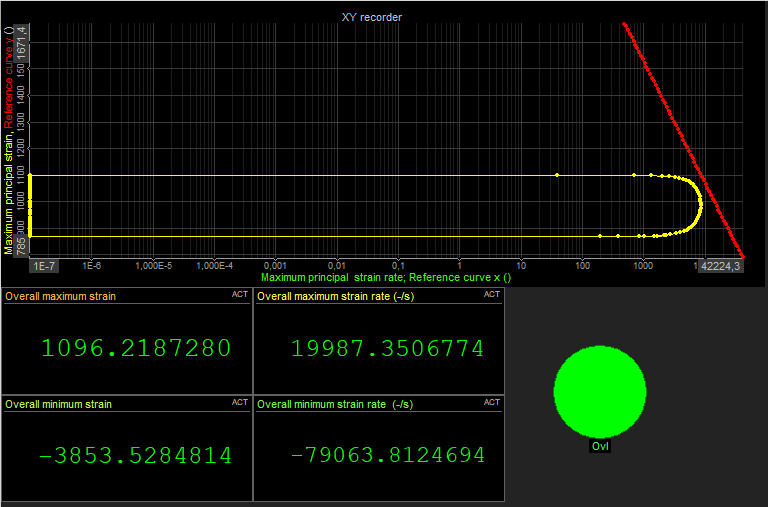 To get an image like this on the XY recorder choose the Graph type to be “Pairs of x-y” and in the Drawing options choose the “Log X” option.
Plot the threshold by first clicking the “Reference curve x” output channel and then the “Reference curve y” output channel.
Plot the maximum principal strain rate vs maximum principal strain graph first clicking the “Maximum principal strain rate” output channel and then the “Maximum principal strain” output channel.
To get an image like this on the XY recorder choose the Graph type to be “Pairs of x-y” and in the Drawing options choose the “Log X” option.
Plot the threshold by first clicking the “Reference curve x” output channel and then the “Reference curve y” output channel.
Plot the maximum principal strain rate vs maximum principal strain graph first clicking the “Maximum principal strain rate” output channel and then the “Maximum principal strain” output channel.