Basic statistics
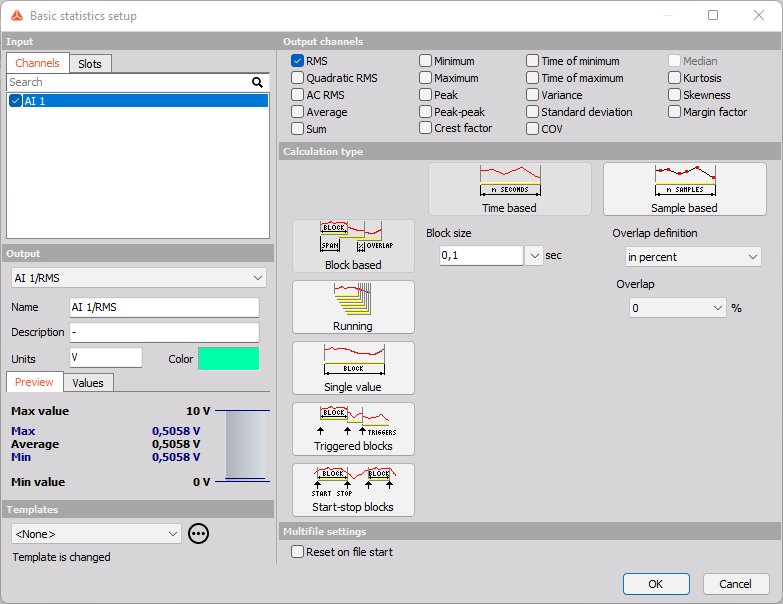
Basic statistics setup window has a standard layout with Input channels in left top corner, Output information in left bottom and output statistics channels on right top. Right bottom is populated by different basic statistic calculation settings as shown on the following picture.
The statistics support multiple input channels.
For detailed information about basic settings of the input and output channels see -> Setup screen and basic operation.
The statistic module provides basic statistical quantities of the signal. There are five basic calculation modes:
All 5 statistic calculation modes can be calculated either as * Time based * Sample based
After choosing input channel,. you need to select which statistical calculation needs to be performed on this channel.
NOTE: For accurate offline post-processing or recalculations, it is essential to store all relevant data channels from the beginning of the measurement. Missing raw data channels will prevent the system from properly utilizing the history required for precise recalculation.
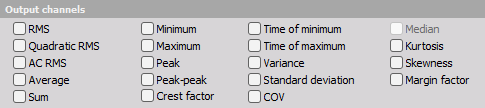
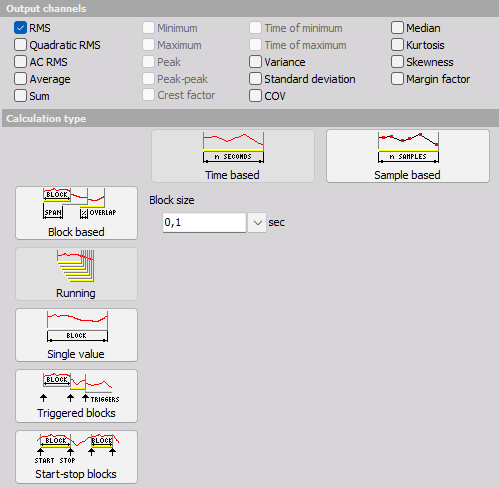
Output channel - Statistical functions
To select statistical function results simply click (check) on the desired check-boxes next to its name on Output channels section:
- RMS - Will calculate the root mean square value of the signal
- Quadratic RMS - This is similar to the RMS, except all the values are double squared and summed.
- AC RMS - Calculates the RMS of the signal after the DC component has been removed.
- Average - will calculate the arithmetic sample mean, given by: $$\overline{x}=\frac{1}{N}\sum_{n=1}^N{x_i}$$ The arithmic mean is approximately equal to the expected value or population mean $\mu$ for larger finite random data populations.
- Sum - Sum of all acquired values in respect of the selected calculation type.
- Minimum - The minimum will calculate a minimum value of the signal for the specified period.
- Maximum - The maximum will calculate a maximum value of the signal for the specified period. This is very intensive operation and therefore unavailable in Running mode.
- Peak - Peak is the absolute maximum value.
- Peak-peak - Is the difference between the minimum and maximum.
- Crest factor - Is the ratio between the peak and RMS value. Crest factor gives an impression about the spikes in the signal. Pure sine waves have a crest factor of 1.41.
- Time of minimum - On the end of the block, it displays the time at which the minimum value occurred.
- Time of maximum - On the end of the block, it displays the time at which the maximum value occurred.
- Variance - is the expected value of the squared deviation from its population mean value $\mu$. The variance Indicates how far values of a signal are spread around the their expected value. The variance is the square of the standard deviation $\sigma$, and is commonly expressed as: $$\text{Var}=\sigma^2$$
- Standard deviation - The standard deviation $\sigma$ is a measure of the spread of the values of the signal away from its population mean $\mu$, measuring how widely spread the values in a data set is. If the data points are close to the mean, then the standard deviation is small (if all the data values are equal, then the standard deviation is zero). The standard deviation for a data set is the square root of its variance.
For finite data sets where all values has the same probability the standard deviation is given by: $$\sigma=\sqrt{\frac{1}{N}\sum_{n=1}^N{(x_n-\mu)^2}},$$ where $\mu$ becomes the average value or arithmic mean described earlier. - COV - Coefficient of variation is the normalized measure of dispersion of probability distribution. It is calculated as the ration between standard deviation and the mean.
- Median - Is the value separating the higher half of a data sample, from the lower half.
The median is not the same as the average mean $\mu$. Having skewed distributions, the mean value can differ from the middle value (the median). - Kurtosis - Is a measure of whether the data are heavy-tailed or light-tailed relative to a normal distribution. Higher kurtosis corresponds to greater extremity of deviations (or outliers). Lower kurtosis tend to have light tails, or lack of outliers. The kurtosis is the fourth standardized moment given by: $$\text{Kurt}=\frac{\mu_4}{\sigma^4},$$ where $\mu_4$ is the fourth central moment and $\sigma$ is the standard deviation.
Kurtosis do not relate to the configuration of data near the mean. The kurtosis value for a normal distribution is 3. Excess Kurtosis is the Kurtosis value minus 3, which gives a value that is relative to a normal distribution. - Skewness - Indicates the lack of symmetry in the distribution or data set around the mean. The skewness for a normal distribution is zero, and any symmetric data should have a skewness near zero. Negative values for the skewness indicate data that are skewed left and positive values for the skewness indicate data that are skewed right. Skewed left means that the left tail (with lower values) is long relative to the right tail. The skewness is the third standardized moment given by: $$\text{Skew}=\frac{\mu_3}{\sigma^3},$$ where $\mu_3$ is the third central moment and $\sigma$ is the standard deviation.
This result is also referred to as Pearson’s moment coefficient of skewness. - Margin factor - Calculates A/RMS, where $$A=\left(\frac{\sum_{n=1}^N\sqrt{|x_n|}}{N}\right)^2$$ is similar to RMS but the root and square are reversed to a SMR. Hereby it can be written as SMR/RMS.
Calculation type
NOTE: Using the user input as a block size value is possible when the user input type is set to the single value. But note that it’s just one time block size set on start and is not meant to change the user input value while measuring. User input is useful when you want to dynamically set the value before the start of measurement. To change the block size while measuring, the start stop block is the way to go. 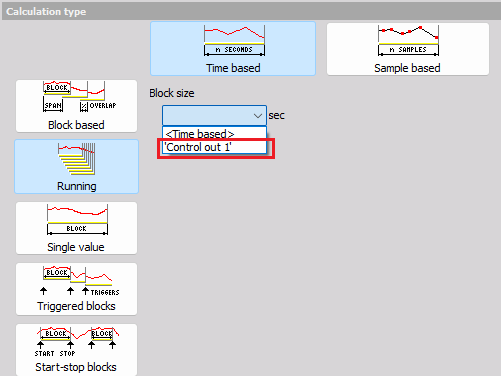
Block based
Block based calculation calculates the statistical quantity based on specific time interval defined by the block size.
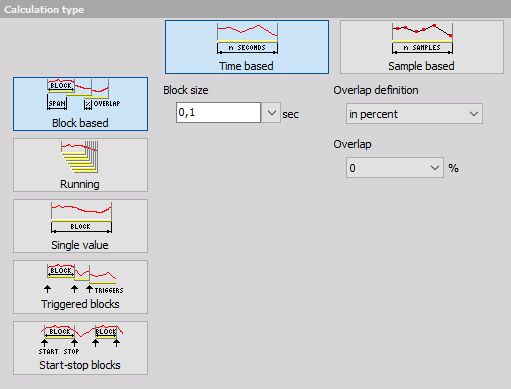
- Block size in [sec] defines the time interval for calculation. 0,1 second in our case means that it will calculate the statistical quantities in 0,1 second interval. Therefore the resulting channels will have an update interval of 0,1 second.
- Overlap - Is useful when we need a specific time interval, but want to have a higher update rate of the resulting channels. In our case, the quantities will be updated in 0,1 second interval with 0% overlap and in 0,05 second interval with 50 % overlap. It means that the second block will not be calculated at the end of the first block, but half of the block before that. So the first block will be calculated from 0 to 0,1 second, second one from 0,05 to 0,15 second, third one from 0,1 to 0,2 second and so on.
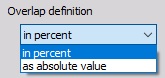
Overlap can be defined:
- in percent -> see above and also Frequency domain filter - Overlap
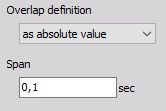
- as absolute value - Span in sec
Running
Running calculation is an ‘extreme’ version of overlapping. The second block is calculated after one sample after the first block. Block size has the same meaning as for block based calculation.
With this method, we can only calculate RMS, Average, Quadratic RMS, Variance and Standard deviation statistical functions, because all others would be too intensive (especially minimum and maximum while all others relate to those two).
Single value
Single value is the simplest calculation and has no settings. It will produce only one value at the end of the measurement. The result will be updated also during the measurement, but only the final value will be stored in the data file.
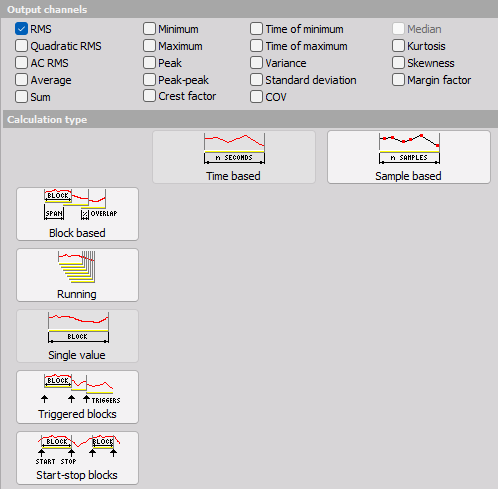
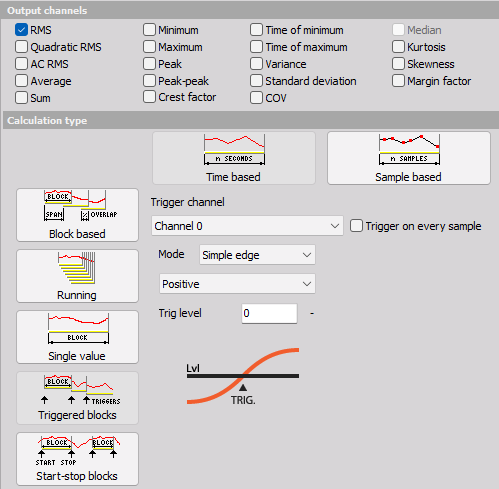
Triggered blocks
Triggered blocks option calculates the statistical value based on a specific trigger event. The calculation begins at the start of the acquisiton. When a trigger event is recognized, it stops the first calculation, writes the statistical value with its timestamp and then starts to calculate a new value. We can define any channel as the trigger channel and the settings for the trigger condition are the same as the alarm or storage triggers.
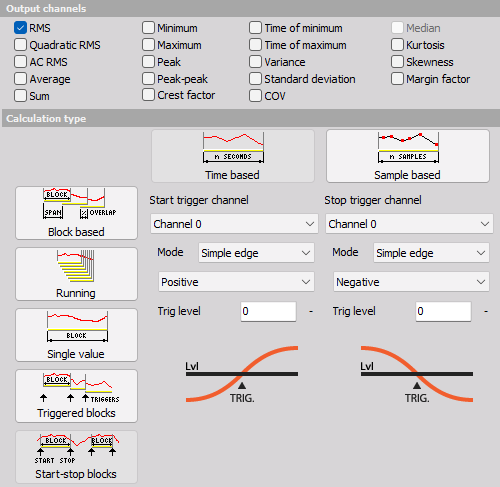
Start/stop blocks
Start/stop blocks option calculates the statistical value starting at a specific trigger event. When an event is recognized, it starts to calculate. When a stop condition is recognized, then the value is written to the resulting channel with the time stamp of stop event. It will wait with the calculation until the new start event is recognized. The start and stop channel can be any channel, also a different one and the trigger condition have the same options as the alarm or storage triggers.
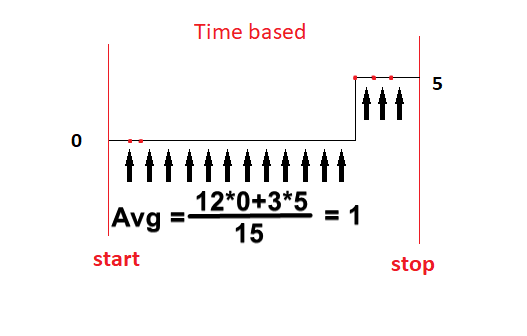
Time vs Sample based calcluations
Dewesoft’s Basic statistics allows users to calculate statistical values of a signal based on Time or Samples.
While both options are valid, the two calculated values differ quite noticeably in the case of asynchronous channels. If we look just a little closer, we notice that Sample based statistics gives us the solution we expect, while Time based statistics yields a seemingly incorrect result.
More detailed information can be found in the following solution example.
Time Based calculation
Time based Basic statistics takes the values of a signal at the specific time stamp. If the signal does not have a sample between two or more time stamps, the calculation takes the value of the previous sample until a new sample arises.
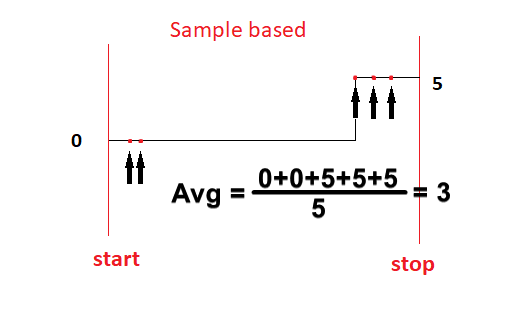
Sample Based calculation
Sample based Basic statistics takes only the values of the signal’s samples. If the signal has a long period without any samples (asynchronous signal), the calculation simply waits for the new sample.