2D/3D mapping
With the 2D/3D mapping module you can add/map/tag one or two additional channels to the selected input channels. In this way you can correlate various measured physical quantities to other measured channels by mapping the data and adding their dimensions together.
For example, a sound pressure signal can be mapped to measured wind speed and hereby output a 2D vector channel with a sound pressure value for each wind speed index defined.
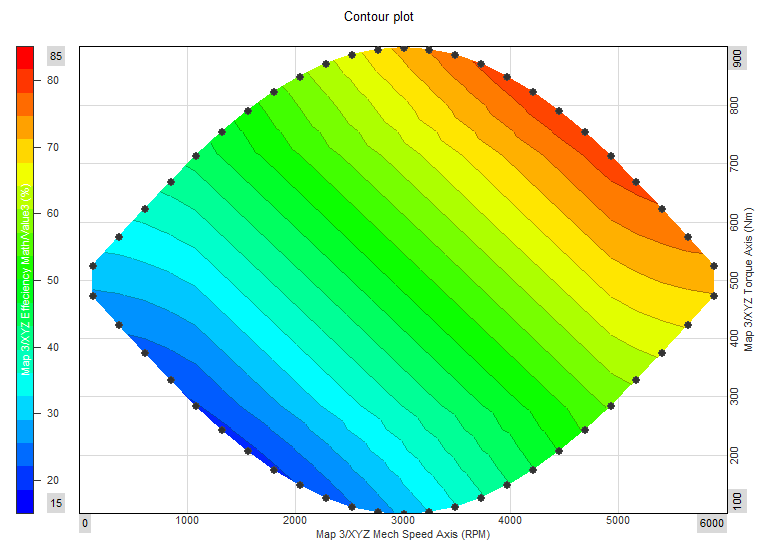
Another example for using the 2D/3D mapping module is for Motor Power Analysis where the mechanical speed and torque is mapped to the calculated power efficiency. This outputs a 3D matrix plot, referred to as an Efficiency map which shows the efficiency across various speeds and torques. A simple simulated illustration of this is shown below using the Contour plot display widget:
Adding the 2D/3D module
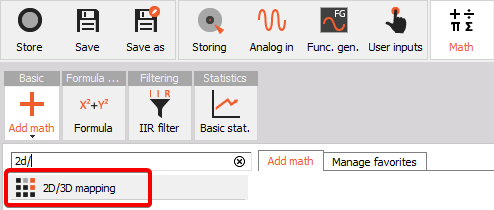
The 2D/3D mapping module can be added to the setup under Math by pressing the Add math button and selecting the 2D/3D mapping module.
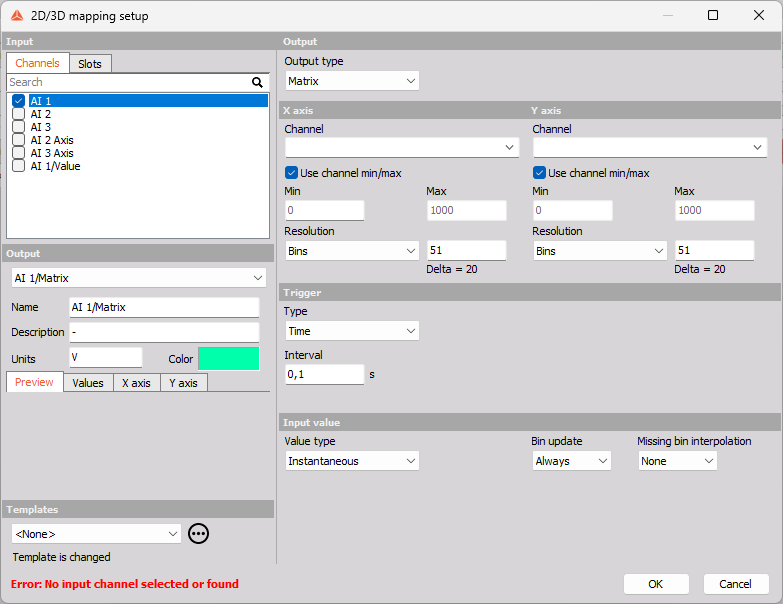
When you add the math module or press the Setup button on newly activated 2D/3D mapping, the following 2D/3D mapping setup window will open:
Linked to Motor Power Analysis
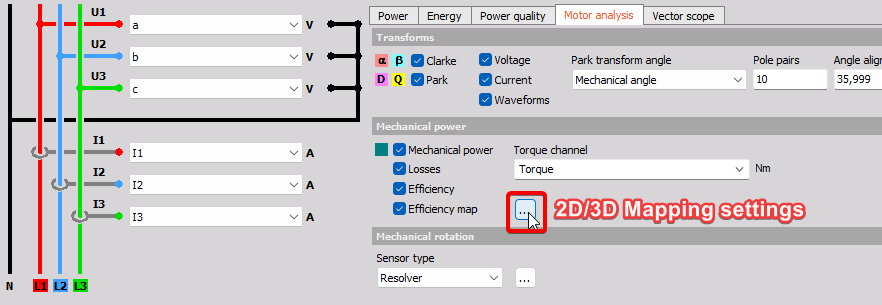
Since the 2D/3D mapping module plays a special role for Motor Power Analysis as an Efficiency map, the module can also be set up directly from the Power Analysis module.
Output
After selecting which input channels you want to map data to, you must define the Output Data structure:
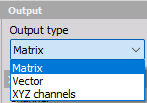
- Vector - will output channels with one additional dimension. Here you must define one bin axis definition. Vector results can e.g. be illustrated using the 2D graph widget.
- Matrix - will output channels with two additional dimensions. Here you must define two bin axis definitions. Matrix results can e.g. be illustrated using the 3D graph widget.
- XYZ channels - will output three individual channels related to the three inputs, but now having the same data rate. XYZ channels results can e.g. be illustrated using the dedicated Contour plot widget.
Axis 1 and 2
Depending on if the Data structure is set to Vector, Matrix, or XYZ channels, you will be able to set-up definitions for one or two bin axes:
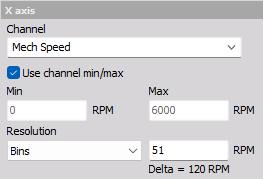
Data structure: Vector
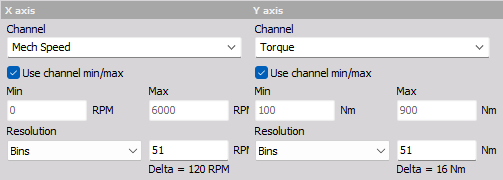
Data structure: Matrix
Use channel min/max
Min. and Max. defines the lower and upper limit of the axis range.
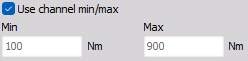
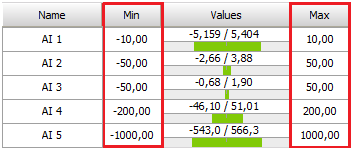
When the ‘Use channel min/max’ checkbox is enabled the axis range is automatically determined from the Min. value and Max. value channel properties. The channel properties Min. and Max. values are found in the channel table for the related channel type, e.g. under Analog in or Math.
Resolution
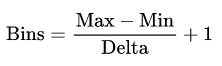
The axis resolution defines the grade with which variating axis values are split into different bins. The resolution can be defined in either number of Bins or in Delta bin width:
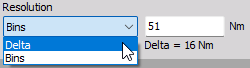
- Bins - Select how many different bins the input values can be classified to. Defined number of bins will determine the Delta bin width based on the Min and Max axis values. The number of bins will be equidistantly spread.
- Delta - Select the axis Bin width and the interval with which the input values can be classified by. The first and last edge bins will have half the Delta width compared to the other bins.
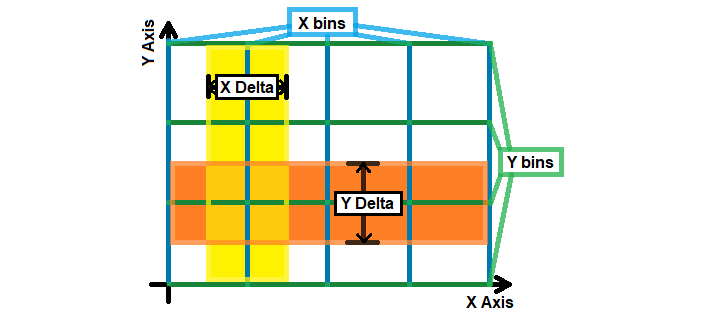
It can be seen from the picture above that the Delta interval of a bin is placed around the center of the bin - having half the Delta width to each side of the bin axis value.
In the above picture the X axis number of bins is set to 5 and the Y axis Bins is set to 4. Delta is defined by:
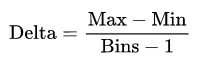
and Bins are defined by:
Trigger
In the 2D/3D mapping module there is a section for Trigger parameters and another section for Input value parameters. The difference between Trigger settings and Input value settings are as follows:
- Trigger settings determine when to include new Input value data for the 2D/3D mapping module output.
- Input value settings determine how to process the raw input data before being added to the output.
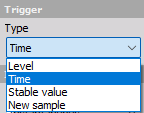
The Input value data can be included based on one of the flowing Trigger Types:
- New sample
- Time
- Level
- Stable value
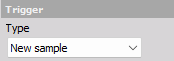
New sample
The Trigger Type New sample will include all input data samples. This Trigger Type is sometimes referred to as Free-run or Continuous.
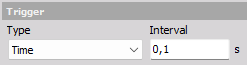
Time
The Trigger Type Time will include new input data with an interval set by the time Interval parameter.
Level
The Level Trigger Type includes new input data each time the selected Trigger Channel activates a new trigger event.
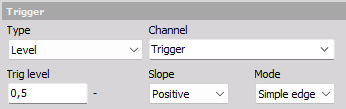
Trigger events are activated based on the trigger parameters: Trig level, Slope, and Mode:
Trig level
The Trig level defines the value needed to be reached/crossed before a trigger event can be activated.
Slope
The Slope defines if a trigger event is activated when the Trig level is crossed with a Positive or Negative Slope/direction:

Mode
The Trigger Mode defines conditions that must be fulfilled before trigger events are activated:

Trigger events are activated:
- Simple edge - each time the Trig level is crossed with the set Slope direction,
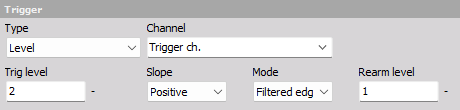
- Filtered edge - similar to Simple edge, but a Rearm level is required to be reached before the next trigger event can be activated.
For example, in the picture below the Slope is Positive and the Rearm level is set to 1. This means that after the trigger Channel has reached the Trig level of 2, then the trigger channel level must decrease below 1 before a new trigger event can be activated. If not the Rearm level is reached then only the first trigger event will be activated.
Stable value
The Trigger Type Stable value includes new input data as long as the data is determined to be stable.
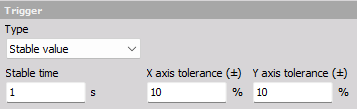
Input channel data are determined to be stable based on the following parameters:
Stable time
Input data across the Stable time interval is used to determine the value deviation. If the value deviation across the Stable time is greater than the defined X or Y axis tolerance, then the input data is not stable in that given axis direction.
X and Y axis tolerance (±)
The X and Y axis tolerance values determine how stable/steady the input data values must be in order to get included in the processing of the 2D/3D module.
Vector and Matrix outputs For Vector and Matrix Output types the X and Y bin tolerances (±) are expressed in percent relative to the bin width Delta. Values are stable if raw input values are not variating more than the set tolerance over a single bin, during the Stable time. If values are shifting between bins they are set as not stable, independent of the used tolerance setting.
XYZ channels outputs For XYZ channels Output type the X and Y axis tolerances (±) are expressed as absolute values with the unit of the axis channel. Values are stable if raw input values are not variating more than the set absolute tolerance.
Input value
The difference between Trigger settings and Input value settings:
- Input value settings determine how to process the raw input data before being added to the output.
- Trigger settings determine when to include new Input value data for the 2D/3D mapping module output.
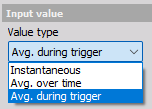
Value type
The Value type determines how raw input data is processed, before being applied to output channels based on triggers.
The following Value types are supported:
- Instantaneous
- Avg. over time
- Avg. during trigger
Instantaneous
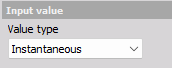
No processing is done - the raw input samples are directly sent to output channels when triggered.
Avg. over time
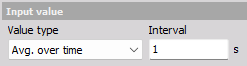
Input samples are linear averaged over the defined averaging time Interval. Averaged values are added to the output result when triggered. New linear mean averaged values are calculated each time the set Interval time has passed.
Avg. during trigger
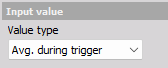
This Value type is only available when using a Level Trigger. Input samples are linear averaged over the full duration of an active Trigger event.
When a trigger event gets activated the averaging begins and when the trigger event ends the averaging stops and the averaged value is added as a new Level triggered output.
Bin update
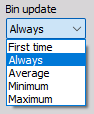
The Bin update determines what to do when multiple values are added to the same axis bin.
The following Bin update modes are supported:
- Always - overwrites the previous bin value.
- First time - keeps the first added bin value.
- Average - linear mean across all values added to a bin.
- Maximum - keeps the maximum value found across all values added to a bin.
- Minimum - keeps the minimum value found across all values added to a bin.
See more about bins under the section Resolution.
Missing bin interpolation
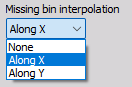
Missing bin interpolation gives the ability to linearly interpolate values for all unmeasured bins between two measured bins.
The following Missing bin interpolation is supported:
- None - no bins get interpolated values. Only measured bins will contain valid values.
- Along X - unmeasured bins between measured X axis bins are linear interpolated.
- Along Y - unmeasured bins between measured Y axis bins are linear interpolated.
For example, selecting interpolation Along X will interpolate unmeasured bins as illustrated in the video below: