Vector reference curve
In the vector reference curve, we define the reference curves for the input channel, which is usually an array (FFT data, …).
When you press the Setup button on newly activated Vector reference curve line, the following setup screen window will open:
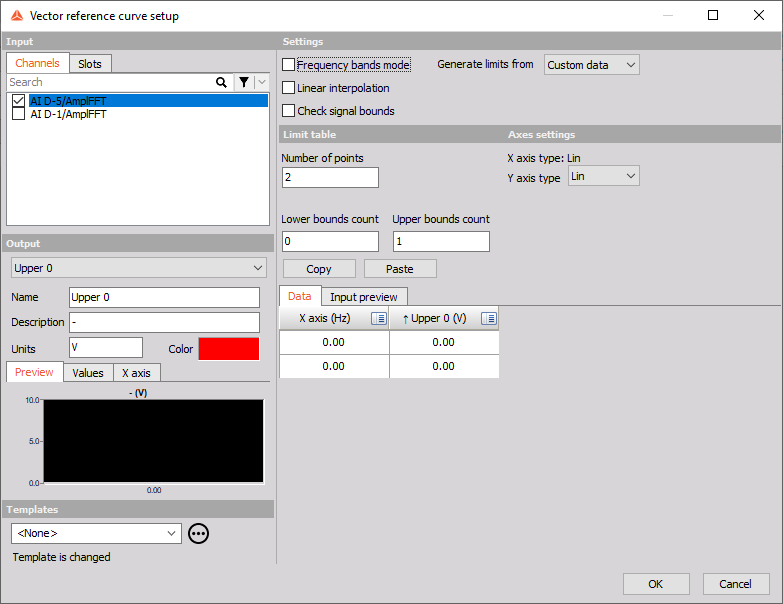
Settings
Vector reference curve math offers the following settings
- Frequency bands mode
With Frequency bands mode, the vector reference curve can be defined as multiple user-defined frequency bands. The reference curves will be displayed (or will check signal bound) exclusively within the specified bands. The frequency gaps can overly between each other. The gap between frequency bands will be visually presented as infinity value.
- Linear interpolation
With linear interpolation, the program will draw a direct line between the two neighborhood points. It will give a smoother transition between the points on the curve.
- Check signal bounds
This will create an additional output channel which will output 1 when the input is higher than the reference curve and will output 0 when the input is below the reference curve
NOTE: When multiple bounds are added, the “Check signal bounds” function will output a value of 0 if the input signal is below all defined bounds. If the input signal is higher than the first bound, the function will output a value of 1. If the input signal is higher than the second bound, the function will output a value of 2, and so on for each additional bound that is defined
- Output alarm on signal
This will create an alarm in Event Data channel. The same behaviour as the Channel limits alarms.
- Generate limits from
You can select to generate limits from custom data or from curent input from the assigned input channel. This will generate vector reference point according to the current values of input channel. This can also be shown in the Input preview tab.
Limit table
- Number of points
Limit table points can be manually defined or by copy/paste from an external program.
- Upper bounds count
Define a custom number of Upper bounds
- Lower bound count
Define a custom number of Lower bounds
- Copy/paste buttons
Wth copy paste buttons you can simply copy the values from the table to e.g. Excel, correct the values and paste the new values back to the Vector Ref Curve Math
NOTE: When multiple bounds are added and the “Check signal bounds” function is enabled, it’s important to ensure that the values of the bounds do not overlap. If there is an overlap between any of the bounds, the function will not be able to accurately determine which bound the input signal falls into and the check will be disabled.
Axes settings
Axes settings can be selected from:
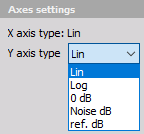
- linear
- logarithmic
- 0 dB (dB reference will be set from the range of the first channel)
- Noise dB (the reference value is 20 uPa)
- ref. dB (user enters the reference value)
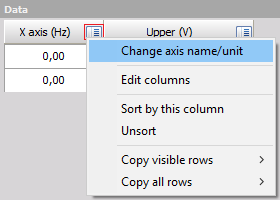
Data
Rename the channels with the click on the icon in the top right corner and selecting the Change axis name/unit option.
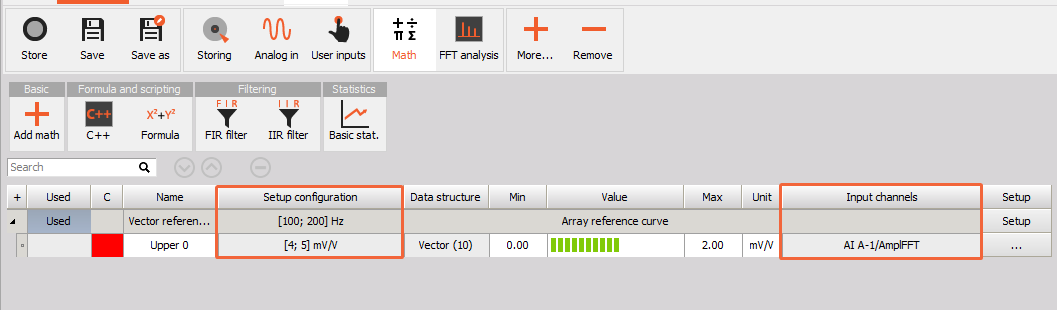
Overview in Math settings
In the Math settings you can now see the overview of Vector Reference curve settings and an input channel. The user needs to add the columns in the grid, as they are not added as default.