Correlation
The Correlation module can be used to detect components in a signal that has associations or causal relationships to other measured signal components. By using the correlation module the time difference between linear related signal components can be determined.
Examples
The determined time difference can e.g. indicate:
- echo components being reflected back to the sensor at a certain distance,
- similar periodic signal events repeated after the time difference,
- time difference between similar signal detection at two difference sensor locations - e.g. used to locate a source position.
Value interpretation
If the correlation result has a value of 1 at a certain time difference then two signals are totally linear related when having that time difference between the signals.
If the correlation result has a value of 0 at a certain time difference then two signals do not have any linear relationship when having that time difference between the signals.
Add module the setup
The Correlation module are found under Math as a math module. After the module has been added the Math channel table will include the Correlation module.
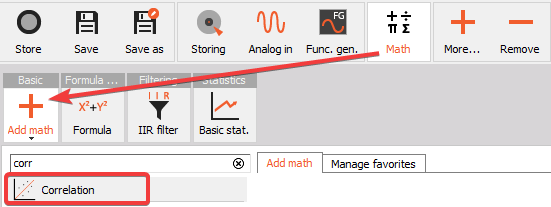
When you add the Correlation module or press the Setup button on the math table row for the Correlation module, the following setup screen window will open:
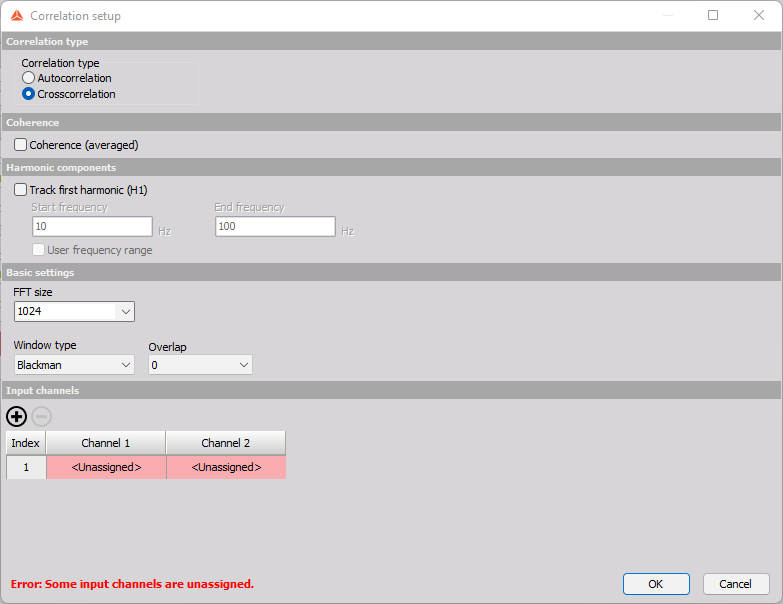
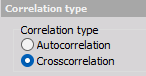
Correlation type
Two types of correlation can be computed:
Autocorrelation
Autocorrelation has one input channel, and determines the linear relationship between the input channel and a delayed version of the same channel. If the autocorrelation result indicates high values at a certain time difference then the input signal contains similar signal components that are happening with the relative delay time between them.
Crosscorrelation
Crosscorrelation has two input channels, and determines the linear relationship between them. If the crosscorrelation result indicates high values at a certain time difference then input 2 contains similar signal components as input 1 at that relative delayed time instance.
An example of correlation data is shown below, where channel 2 has a linear relationship with channel 1 at a time difference of 100 ms, since the correlation value is around 1 at that delay time:
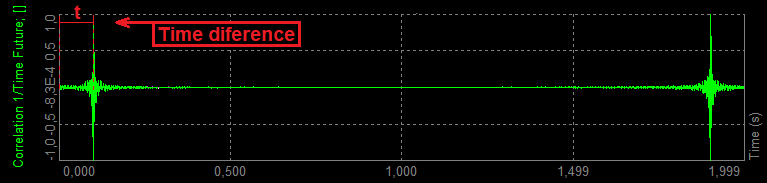
The correlation graph shown above also indicates a symmetric linear relationship positioned at the block length T minus the time difference t. This peak appears due to the used cyclic calculation procedure and can in most cases be neglegted.
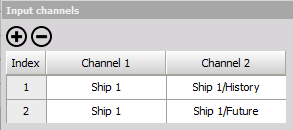
Input Channels
Note that you can select multiple channels to be auto- or crosscorrelated in the Input channels table, by adding more rows using the + button:
Basic settings
Basic settings are used to set the block length. The block length defines the maximum time difference the correlation data can support.
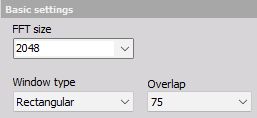
Block size
The block length is set indirectly by the FFT size parameter, which defines the number of FFT lines. The block length is given by:

For example: when using a sample rate of 25600 Hz and a Block size of 2048 FFT lines, then the Block length T will be equal to 0.16 s. Hereby, 0.16 s is the maximum correlation time difference that can be determined with such settings.
Window type and Overlap
In most cases it is recommended to use a Window type like Hanning in order to reduce leakage and thereby getting peaks in the correlation results that are more clearly indicated. When using a Hanning weighting Window type an Overlap of 66 % or 75 % should be selected in order to obtain a steady value readout.
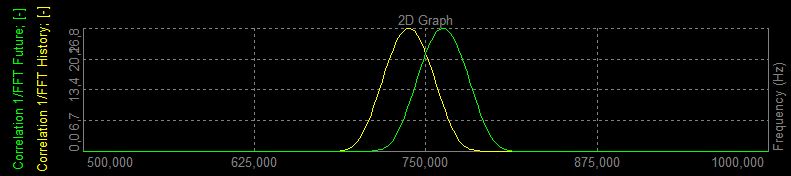
Below an two FFT spectra from the correlation module is illustrated, showing chirp signals while using Hanning weighting:
Coherence and Harmonic components
When crosscorrelation is selected you can track frequency peaks values and/or output coherence function between the two channels.
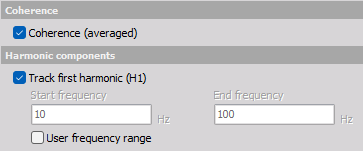
Coherence
Coherence graphs indicate how well Input 1 and Input 2 are linearly related with respect to frequency. For example, if the correlation result includes high correlation, but the FFT spectrum contains too many components to be able to easily determine which of the frequences that are causing the high correlation, then the coherence graph will indicate this.
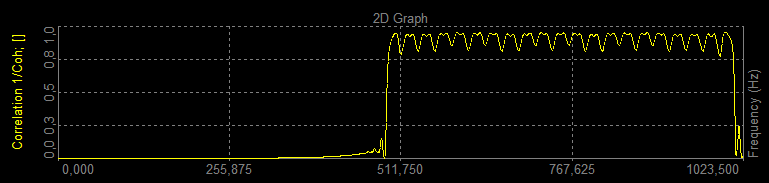
A coherence value of 1 at a certain frequency indicates that the two signals are totally linear related at that frequnecy. A coherence value of 0 at a certain frequency indicates that the two signals do not have any linear relationship at that frequnecy.
The coherence result will be based on averaged data from start to stop of the measurement.
Track first harmonic (H1)
Track first harmonic (H1) can be used to detect the maximum frequency component in the related FFT spectrum for each input. For each FFT block the maximum frequency component value will be extracted to a time trace channel, as illustrated below.
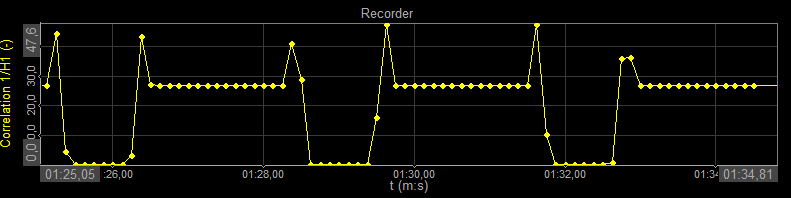
The time trace channels can be shown on the Recorder widget.