Order marker
NOTE: Shared marker parameter information is described under the Processing markers page.
Rotational order components of e.g. noise, current, and vibration can be extracted precisely from measurements via the angle domain data using our Order analysis application module. Still in some cases order extraction from frequency domain data is also relevant. This is possible using the Order marker:
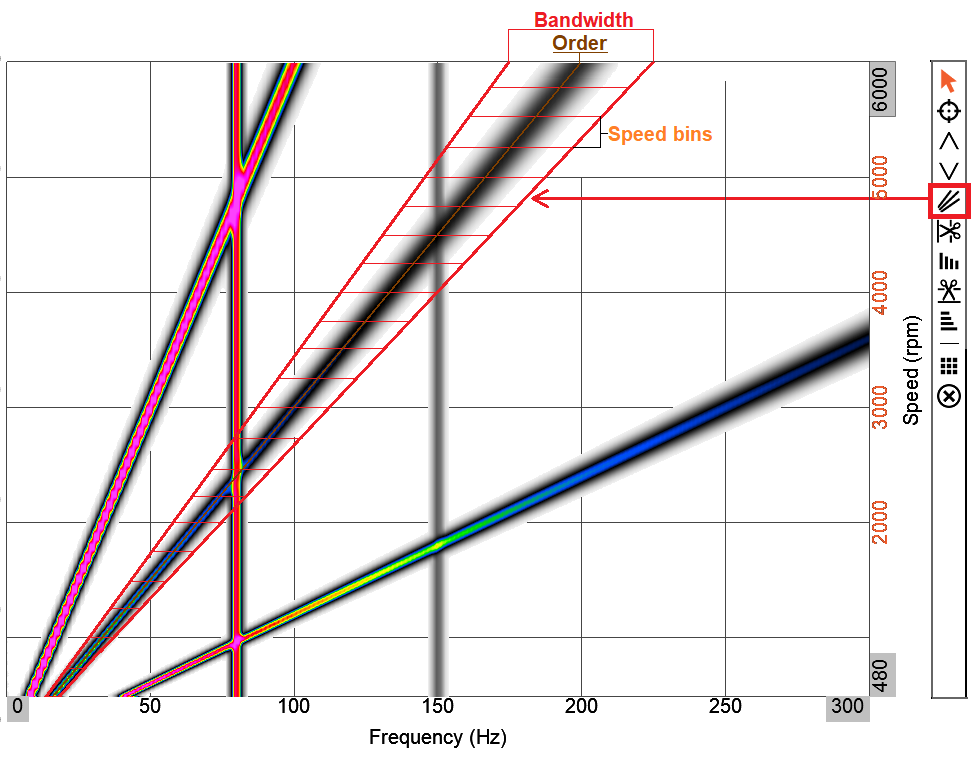
The Order marker can be selected in 3D graph widgets from the marker list as indicated above. For each speed bin an order value will be calculated based on the selected Bandwidth around the selected Order.
The Order marker determines order magnitudes based on an adjustable frequency width, across speeds. The result is a vector of order magnitudes vs. speed, to be visualized in e.g. a 2D graph widget.
The order marker can be selected on 3D graph widgets for frequency waterfall vs. speed data, e.g. coming from Order analysis or Orbit analysis. The calculation bandwidth of the order maker can be adjusted with either fixed frequency width or fixed order width, to accommodate most applications:
Each order marker lets you define the center order, the bandwidth and the calculation type.
The default calculation type is the Energy sum of the selected bandwidth, but it can also be set to Max value within that bandwidth.
You can add as many order maker channels as desired. Each marker will be available as derived order vs speed marker channels for further analysis.
Each Order marker can be moved around directly on the 3D plot without having to enter the marker editor, just click and drag the center order trace line:
In the illustration above multiple order markers have been added and adjusted on a 3D graph widget. Marker results are visualized in a 2D graph widget underneath. The order magnitude results in the 2D graph follow the selected order bandwidth area as it is dragged around on the 3D graph.