Setting - display tools
The Scope instrument typical settings include three main groups:
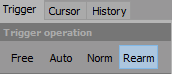
- Trigger
- Free run
- Auto
- Norm
- Single - settings of triggered acquisition
- Cursor - cursor measurement to show the cursor readouts for each channel within the selected scope; with Reference curves possibility
- Scale - to change displayed offset and scaling of signals
- History - to display the trigger events in different ways -> history type, to select how many trigger events will be used, to browse through the trigger events, to export the acquired data
Trigger setting
Dewesoft knows four types of Trigger operation -> Triggered acquisition:
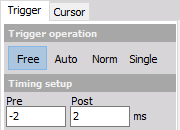
Free run
All values are displayed, no trigger active. There are no additional settings.
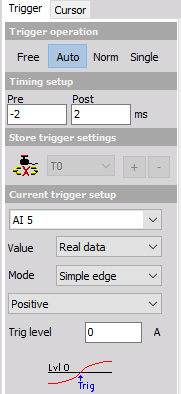
Auto
The auto trigger displays values if the trigger condition is true; when there is no trigger within some time, it displays the current value.
For this type of Trigger operation can be set:
Current trigger setup with:
- select the desired channel
- define the Value
- define the Mode - trigger type
- setup trigger condition for selected trigger type:
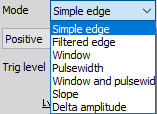
Mode:
- Simple edge
- Filtered edge
- Window
- Pulse-Width
- Window and pulse-width
- Slope
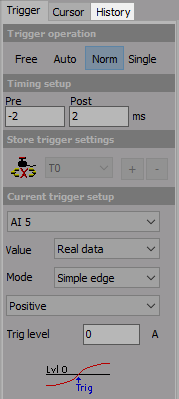
Norm
The normal trigger displays only values if the trigger condition is true.
For this type of Trigger operation can be set the same setting as for Auto trigger -> see above.
When the Norm (or Single) trigger is selected, another tab appears -> the History.
Single
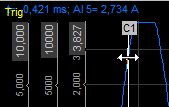
This function can be used to acquire single events.
After selecting single button:
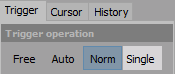
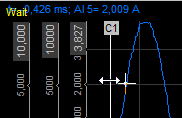
and event appear this button changes to Rearm:
Press it to get another single shot event.
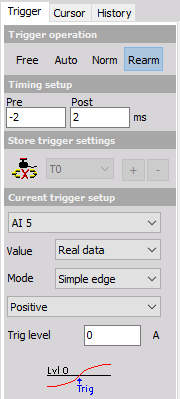
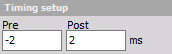
Timing setup
The Timing setup can be used to define the displayed Pre and Post trigger time in milliseconds.
NOTE: Like the trigger level, the trigger position can be changed within the displayed time window by moving the white vertical line in the scope graph. Simply click on the line, keep the mouse button pressed and move the line to the desired position.
The time window can also be changed using the buttons at the right bottom of each graph.


Current trigger setup
The trigger conditions for Auto, Norm and Single data trigger are the same and work in the same way than described in Using trigger to start and stop recording.
For detailed information about using triggers see -> Manually Start / Stop Recording.
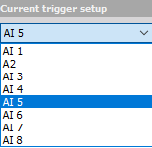
- Select the desired channel First of all you have to select the desired channel out of the drop-down list. It displays all available channels.
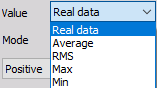
- Define the value Select the Real data, Average or RMS from the drop-down list.
- Define the mode Select the trigger type Simple edge, Filtered edge, Window, Pulse-Width, Window and pulse-width or Slope from the drop-down list.
- Setup other These settings (e.g. Slope, Trigger level, Rearm level, Pulse time,…) depend on selected trigger type in Mode field.
For detailed information about trigger mode and set up triggers see -> Manually Start / Stop Recording.
HINT: The trigger level can also be changed by moving the white vertical line in the scope graph. Simply click on the line, keep mouse button pressed and move the line to the desired position.
Store trigger settings
This is a very nice function to define the storing options directly within the scope.
For detailed information about set up trigger see -> Manually Start / Stop Recording.
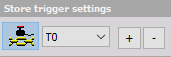
Any changes done here are automatically copied to the system trigger and vice versa. To activate this function press the Link store trigger button.
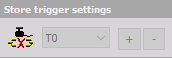
The drop-down list next to the button shows - if already available - existing triggers conditions or starts with a fresh entry T0.
The buttons can be used to define additional conditions, which can be selected by the drop-down list and changed according to your requirements.
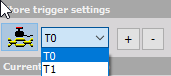
The buttons can be used to delete selected additional conditions.
Cursor
Cursor measurements
Dewesoft offers also Cursor measurements function to show the cursor readouts for each channel within the selected scope. Select the Cursor tab to activate the cursor measurement:
The scope offers two measurement cursors for the active graph, which can be positioned in two ways:
- Move the mouse cursor to the first position of interest. Click the left mouse button - cursor C1 will appear.

- Move the mouse cursor to the second position of interest and click right mouse button for cursor C2 positioning.

This can be repeated at any other desired position.
- Drag the first cursor from the left side of the graph to the position of interest and the second cursor from the right side of the graph. In both case cursor appearance on measurement cursors .jpg must change to:

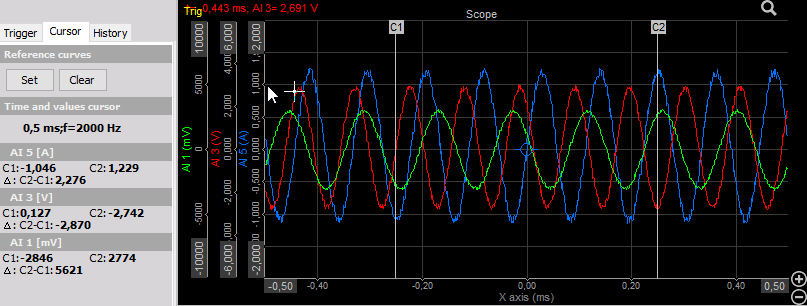
The settings menu at the left side of the screen now displays:
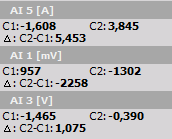
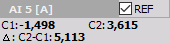
- The cursor readouts for each channel within the selected scope - values at C1, C2 and difference C2-C1
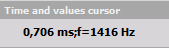
- Time and values cursor between C1 and C2
WARNING: The freeze function is not working in the scope!
Reference Curves
Dewesoft offers also Reference curves within the scope display.
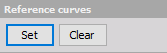
To activate them just press the Set button in the Reference curves Cursor settings.
This will copy the data of all currently displayed channels into a reference curves memory. The reference curve will now be displayed in white color:
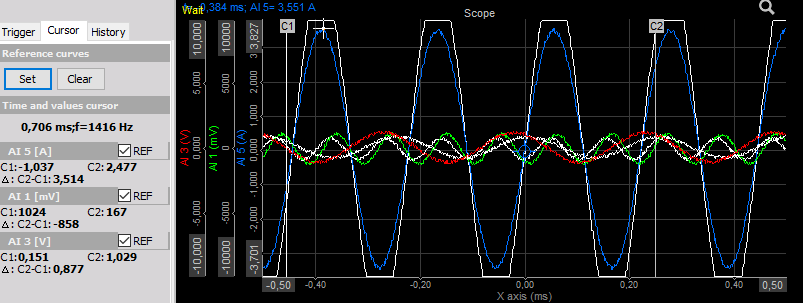
In the cursor readouts for each channel REF check-box appear:
To hide the reference curve uncheck the REF check-box for the desired channel(s). This will keep the reference curve within memory. To display it again just check the REF check-box again.
Press the Set button at any time to update the reference curve to the current triggered data.
To remove the reference curve permanently press the Clear button. This will remove the reference curve data from memory. To define a new reference curve press the Set button again.
A dashed horizontal line indicates the current offset setting of each channel. It has the same color than the channel itself. You can use this line also to change the channel offset.
Simply move the mouse cursor over the line and the mouse cursor appearance will change to:
![]()
Now click (and keep mouse button pressed) and move the dashed line to the desired offset position.
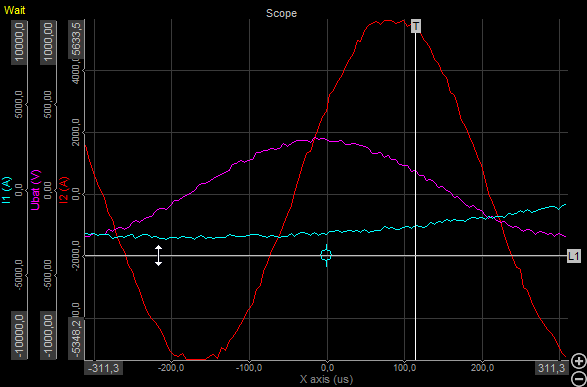
Examples for scaling and offset functions:
Scope Scale view after scale down Power channel:
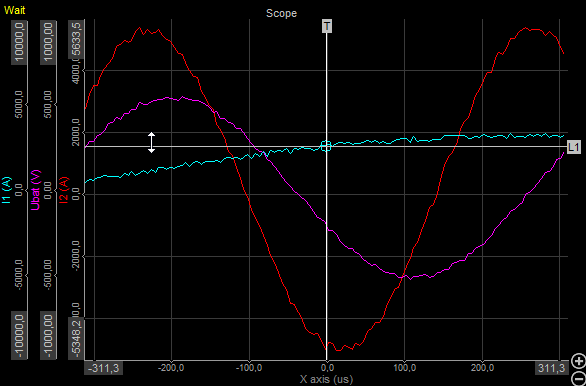
And after set negative offset for Power channel:
History
When the Norm or Single trigger is selected, another tab appears: the History. This feature allows you to display the following information - history type:
- Actual trigger - Always the latest trigger event is displayed. When you press the Stop button, you can browse through the last recorded trigger events.
- Persistence mode - You may still know this feature from analog oscilloscopes: several events will be displayed in an overlay technique, the older the events the brighter their color.
- Moving average - Use the moving average function only for repetitive signals; you can increase accuracy and reduce noise on signals using this function.
- Envelope - The envelope mode displays two graphs showing the minimum and maximum value of several events.
- 3D view - Displays the trigger events in a waterfall-like type. Very helpful to show signal abnormalities or changes.
Display mode can be selected from Display mode drop down list:
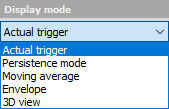
The following screen should help you to understand the difference between the five history types:
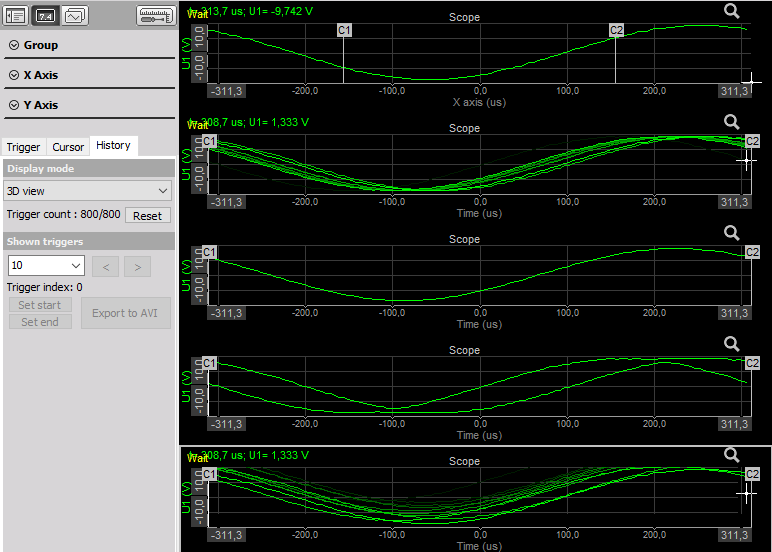
Below the Display mode selection, the Trigger count displays two values: the first mentions the current number of existing trigger events within the history memory, the second the maximum possible number of events. This value depends dramatically from the displayed time. When the maximum number is reached, both values are the same. The memory is of FIFO type (first in, first out).
If you want to clear the history memory simply press the Reset button.
In the section Shown triggers you can select how many trigger events will be used for the appropriate history type.
If you are in stopped condition (when you press the Stop butt on tool bar) you can use the arrow buttons to browse through the trigger events.
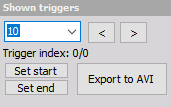
Keep an eye on the Trigger index: it shows you the current positions within the available events.
In stopped condition it’s also possible to export the acquired data by pressing the Export to AVI or Save to file button.
When Export to AVI is selected Scope AVI export window appear to set: File name, Resolution, Frame rate, Video compression and Export triggers field, in which we can define to save only interesting triggered events (to reduce the amount of data).
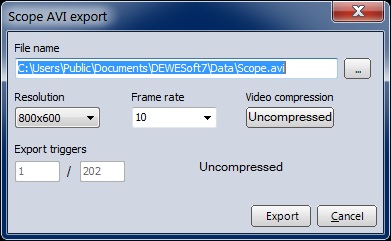
For information about this settings see -> Export instrument display to Video.
Select Export button to export ‘avi’ data or Cancel button to cancel exporting.
Whit Save to file button we call Save Scope Pictures window to save acquired data from history memory in to Dewesoft *.dsd (Dewesoft data) file:
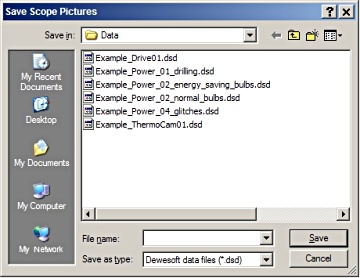
Choose existing file from list or enter new file name (recommended) and then select Save button to save data or Cancel button to cancel saving.
To reduce the amount of data you can select a certain range within the triggered events by using the Set start and Set end buttons.